Modelling for accuracy

Recently I’ve been remembering the first assignment of my “quantitative methods 2” course at IIMB back in 2004. In the first part of that course, we were learning regression. And so this assignment involved a regression problem. Not too hard at first sight – maybe 3 explanatory variables.

We had been randomly divided into teams of four. I remember working on it in the Computer Centre, in close proximity to some other teams. I remember trying to “do gymnastics” – combining variables, transforming them, all in the hope of trying to get the “best possible R square”. From what I remember, most of the groups went “R square hunting” that day. The assignment had been cleverly chosen such that for an academic exercise, the R Square wasn’t very high.

As an aside – one thing a lot of people take a long time to come to terms with is that in “real life” (industry problems) R squares aren’t usually that high. Forecast accuracy isn’t that high. And that the elegant methods they had learnt back in school / academia may not be as elegant any more in industry. I think I’ve written about this, but I can’t find the link now.

Anyway, back to QM2. I remember the professor telling us that three groups would be chosen at random on the day of the assignment submission, and from each of these three groups one person would be chosen at random who would have to present the group’s solution to the class. I remember that the other three people in my group all decided to bunk class that day! In any case, our group wasn’t called to present.

The whole point of this massive build up is – our approach (and the approach of most other groups) had been all wrong. We had just gone in a mad hunt for R square, not bothering to figure out whether the wild transformations and combinations that we were making made any business sense. Moreover, in our mad hunt for R square, we had all forgotten to consider whether a particular variable was significant, and if the regression itself was significant.

What we learnt was that while R square matters, it is not everything. The “model needs to be good”. The variables need to make sense. In statistics you can’t just go about optimising for one metric – there are several others. And this lesson has stuck with me. And guides how I approach all kinds of data modelling work. And I realise that is in conflict with the way data science is widely practiced nowadays.

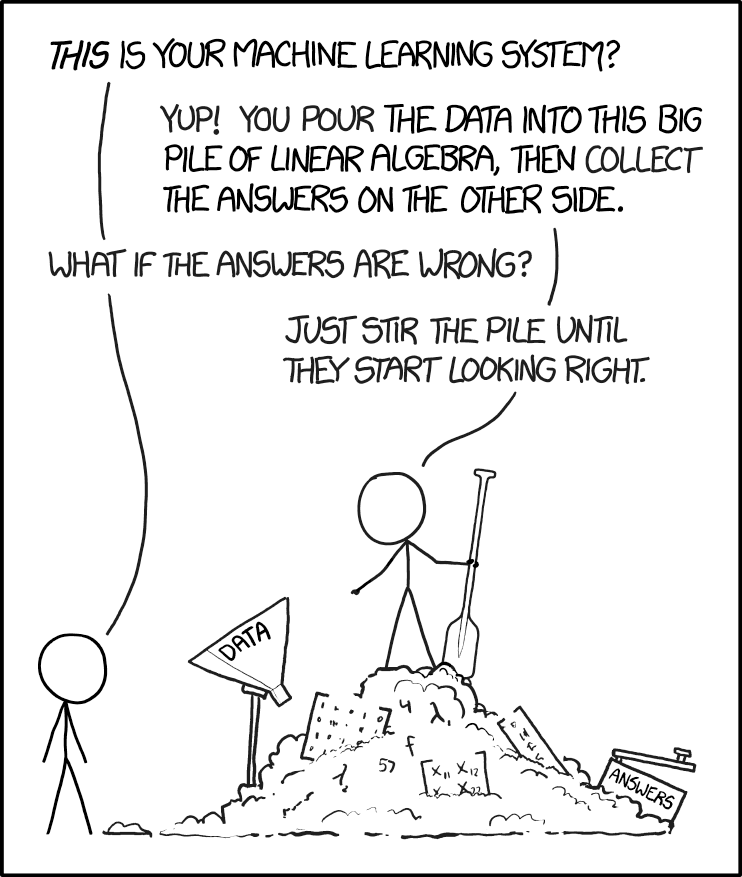
The way data science is largely practiced in the wild nowadays is precisely a mad hunt for R Square (or area under ROC curve, if you’re doing a classification problem). Whether the variables used make sense doesn’t matter. Whether the transformations are sound doesn’t matter. It doesn’t matter at all whether the model is “good”, or appropriate – the only measure of goodness of the model seems to be the R square!

In a way, contests such as Kaggle have exacerbated this trend. In contests, typically, there is a precise metric (such as R Square) that you are supposed to maximise. With contests being evaluated algorithmically, it is difficult to evaluate on multiple parameters – especially not whether “the model is good”. And since nowadays a lot of data scientists hone their skills by participating in contests such as on Kaggle, they are tuned to simply go R square hunting.

Also, the big difference between Kaggle and real life is that in Kaggle, the model that you build doesn’t matter. It’s just a combination. You get the best R square. You win. You take the prize. You go home.

You don’t need to worry about how the data for the model was collected. The model doesn’t have to be implemented. No business decisions need to be made based on the model. Contest done, model done.

Obviously that is not how things work in real life. Building the model is only one in a long series of steps in solving the business problem. And when you focus too much on just one thing – the model’s accuracy in the data that you have been given, a lot can be lost in the rest of the chain (including application of the model in future situations).

And in this way, by focussing on just a small portion of the entire data science process (model building), I think Kaggle (and other similar competition platforms) has actually done a massive disservice to data science itself.

Tailpiece

This is completely unrelated to the rest of the post, but too small to merit a post of its own.

Suppose you ask a software engineer to sort a few datasets. He goes about applying bubble sort, heap sort, quick sort, insertion sort and a whole host of other techniques. And then picks the one that sorted the given datasets fastest.

That’s precisely how it seems “data science” is practiced nowadays

Liverpool FC: Mid Season Review

After 20 games played, Liverpool are sitting pretty on top of the Premier League with 58 points (out of a possible 60). The only jitter in the campaign so far came in a draw away at Manchester United.

I made what I think is a cool graph to put this performance in perspective. I looked at Liverpool’s points tally at the end of the first 19 match days through the length of the Premier League, and looked at “progress” (the data for last night’s win against Sheffield isn’t yet up on my dataset, which also doesn’t include data for the 1992-93 season, so those are left out).

Given the strength of this season’s performance, I don’t think there’s that much information in the graph, but here it goes in any case:

I’ve coloured all the seasons where Liverpool were the title contenders. A few things stand out:

  1. This season, while great, isn’t that much better than the last one. Last season, Liverpool had three draws in the first half of the league (Man City at home, Chelsea away and Arsenal away). It was the first month of the second half where the campaign faltered (starting with the loss to Man City).
  2. This possibly went under the radar, but Liverpool had a fantastic start to the 2016-17 season as well, with 43 points at the halfway stage. To put that in perspective, this was one more than the points total at that stage in the title-chasing 2008-9 season.
  3. Liverpool went close in 2013-14, but in terms of points, the halfway performance wasn’t anything to write home about. That was also back in the time when teams didn’t dominate like nowadays, and eighty odd points was enough to win the league.

This is what Liverpool’s full season looked like (note that I’ve used a different kind of graph here. Not sure which one is better).


Finally, what’s the relationship between points at the end of the first half of the season (19 games) and the full season? Let’s run a regression across all teams, across all 38 game EPL seasons.

The regression doesn’t turn out to be THAT significant, with an R Squared of 41%. In other words, a team’s points tally at the halfway point in the season explains less than 50% of the variation in the points tally that the team will get in the second half of the season.

Coefficients:
            Estimate Std. Error t value Pr(>|t|)    
(Intercept)  9.42967    0.97671   9.655   <2e-16 ***
Midway       0.64126    0.03549  18.070   <2e-16 ***
---
Signif. codes:  0 ‘***’ 0.001 ‘**’ 0.01 ‘*’ 0.05 ‘.’ 0.1 ‘ ’ 1

Residual standard error: 6.992 on 478 degrees of freedom
  (20 observations deleted due to missingness)
Multiple R-squared:  0.4059,    Adjusted R-squared:  0.4046 
F-statistic: 326.5 on 1 and 478 DF,  p-value: < 2.2e-16

The interesting thing is that the coefficient of the midway score is less than 1, which implies that teams’ performances at the end of the season (literally) regress to the mean.

55 points at the end of the first 19 games is projected to translate to 100 at the end of the season. In fact, based on this regression model run on the first 19 games of the season, Liverpool should win the title by a canter.

PS: Look at the bottom of this projections table. It seems like for the first time in a very long time, the “magical” 40 points might be necessary to stave off relegation. Then again, it’s regression (pun intended).

More on statistics and machine learning

I’m thinking of a client problem right now, and I thought that something that we need to predict can be modelled as a function of a few other things that we will know.

Initially I was thinking about it from the machine learning perspective, and my thought process went “this can be modelled as a function of X, Y and Z. Once this is modelled, then we can use X, Y and Z to predict this going forward”.

And then a minute later I context switched into the statistical way of thinking. And now my thinking went “I think this can be modelled as a function of X, Y and Z. Let me build a quick model to see if the goodness of fit, and whether a signal actually exists”.

Now this might reflect my own biases, and my own processes for learning to do statistics and machine learning, but one important difference I find is that in statistics you are concerned about the goodness of fit, and whether there is a “signal” at all.

While in machine learning as well we look at what the predictive ability is (area under ROC curve and all that), there is a bit of delay in the process between the time we model and the time we look for the goodness of fit. What this means is that sometimes we can get a bit too certain about the models that we want to build without thinking if in the first place they make sense and there’s a signal in that.

For example, in the machine learning world, the concept of R Square is not defined for regression –  the only thing that matters is how well you can predict out of sample. So while you’re building the regression (machine learning) model, you don’t have immediate feedback on what to include and what to exclude and whether there is a signal.

I must remind you that machine learning methods are typically used when we are dealing with really high dimensional data, and where the signal usually exists in the interplay between explanatory variables rather than in a single explanatory variable. Statistics, on the other hand, is used more for low dimensional problems where each variable has reasonable predictive power by itself.

It is possibly a quirk of how the two disciplines are practiced that statistics people are inherently more sceptical about the existence of signal, and machine learning guys are more certain that their model makes sense.

What do you think?

Statistics and machine learning approaches

A couple of years back, I was part of a team that delivered a workshop in machine learning. Given my background, I had been asked to do a half-day session on Regression, and was told that the standard software package being used was the scikit-learn package in python.

Both the programming language and the package were new to me, so I dug around a few days before the workshop, trying to figure out regression. Despite my best efforts, I couldn’t locate how to find out the R^2. What some googling told me was surprising:

There exists no R type regression summary report in sklearn. The main reason is that sklearn is used for predictive modelling / machine learning and the evaluation criteria are based on performance on previously unseen data

As it happened, I requested the students at the workshop to install a package called statsmodels, which provides standard regression outputs. And then I proceeded to lecture to them on regression as I know it, including significance scores, p values, t statistics, multicollinearity and the likes. It was only much later was I to figure out that that is now how regression (and logistic regression) is done in the machine learning world.

In a statistical framework, the data sets in regression are typically “long” – you have a large number of data points, and a small number of variables. Putting it differently, we start off with a model with few degrees of freedom, and then “constrain” the variables with a large enough number of data points, so that if a signal exists, and it is in the right format (linear relationship and all that), we can pin it down effectively.

In a machine learning framework, it is common to run a regression where the number of data points is of the same order of magnitude as, or even smaller than the number of variables. Strictly speaking, such a problem is unbounded (there are too many degrees of freedom), and so regression is not well-defined. Instead, we rely upon “regularisation methods” to “tie down” the variables and (hopefully) produce a consistent solution.

Moreover, machine learning approaches are common to problems where individual predictor variables don’t have meaning. In this scenario, knowing whether a particular variable is significant or not is of no utility. Then, the signal in machine learning lies in the combination of variables, which means that multicollinearity (correlation between predictor variables) is not really a bad thing as it is in statistics. Variables not having meanings means that there are no correlations per se to be defined, and so machine learning models are harder to interpret, and are more likely to have hidden spurious correlations.

Also, when you have a small number of variables and a large number of data points, it is easy to get an “exact solution” for regression, which is what statistical methods use. In a machine learning framework with “wide” data, though, exact solutions are computationally infeasible, and so you need to use approximate algorithms such as gradient descent – which are common across ML techniques.

All in all, while statistics and machine learning might use techniques with the same name (“regression”, for example), they are both in theory and practice, very different ways to solve the problem. The important thing is to figure out the approach most suited for a particular problem, and use it accordingly.

Machine learning and degrees of freedom

For starters, machine learning is not magic. It might appear like magic when you see Google Photos automatically tagging all your family members correctly, down to the day of their birth. It might appear so when Siri or Alexa give a perfect response to your request. And the way AlphaZero plays chess is almost human!

But no, machine learning is not magic. I’d made a detailed argument about that in the second edition of my newsletter (subscribe if you haven’t already!).

One way to think of it is that the output of a machine learning model (which could be anything from “does this picture contain a cat?” to “is the speaker speaking in English?”) is the result of a mathematical formula, whose parameters are unknown at the beginning of the exercise.

As the system gets “trained” (of late I’ve avoided using the word “training” in the context of machine learning, preferring to use “calibration” instead. But anyway…), the hitherto unknown parameters of the formula get adjusted in a manner that the formula output matches the given data. Once the system has “seen” enough data, we have a model, which can then be applied on unknown data (I’m completely simplifying it here).

The genius in machine learning comes in setting up mathematical formulae in a way that given input-output pairs of data can be used to adjust the parameters of the formulae. The genius in deep learning, which has been the rage this decade, for example, comes from a 30-year old mathematical breakthrough called “back propagation”. The reason it took until a few years back for it to become a “thing” has to do with data availability, and compute power (check this terrific piece in the MIT Tech Review about deep learning).

Within machine learning, the degree of complexity of a model can vary significantly. In an ordinary univariate least squares regression, for example, there are only two parameters the system can play with (slope and intercept of the regression line). Even a simple “shallow” neural network, on the other hand, has thousands of parameters.

Because a regression has so few parameters, the kind of patterns that the system can detect is rather limited (whatever you do, the system can only draw a line. Nothing more!). Thus, regression is applied only when you know that the relationship that exists is simple (and linear), or when you are trying to force-fit a linear model.

The upside of simple models such as regression is that because there are so few parameters to be adjusted, you need relatively few data points in order to adjust them to the required degree of accuracy.

As models get more and more complicated, the number of parameters increases, thus increasing the complexity of patterns that can be detected by the system. Close to one extreme, you have systems that see lots of current pictures of you and then identify you in your baby pictures.

Such complicated patterns can be identified because the system parameters have lots of degrees of freedom. The downside, of course, is that because the parameters start off having so much freedom, it takes that much more data to “tie them down”. The reason Google Photos can tag you in your baby pictures is partly down to the quantum of image data that Google has, which does an effective job of tying down the parameters. Google Translate similarly uses large repositories of multi-lingual text in order to “learn languages”.

Like most other things in life, machine learning also involves a tradeoff. It is possible for systems to identify complex patterns, but for that you need to start off with lots of “degrees of freedom”, and then use lots of data to tie down the variables. If your data is small, then you can only afford a small number of parameters, and that limits the complexity of patterns that can be detected.

One way around this, of course, is to use your own human intelligence as a pre-processing step in order to set up parameters in a way that they can be effectively tuned by data. Gopi had a nice post recently on “neat learning versus deep learning“, which is relevant in this context.

Finally, there is the issue of spurious correlations. Because machine learning systems are basically mathematical formulae designed to learn patterns from data, spurious correlations in the input dataset can lead to the system learning random things, which can hamper its predictive power.

Data sets, especially ones that have lots of dimensions, can display correlations that appear at random, but if the input dataset shows enough of these correlations, the system will “learn” them as a pattern, and try to use them in predictions. And the more complicated your model gets, the harder it is to know what it is doing, and thus the harder it is to identify these spurious correlations!

And the thing with having too many “free parameters” (lots of degrees of freedom but without enough data to tie down the parameters) is that these free parameters are especially susceptible to learning the spurious correlations – for they have no other job.

Thinking about it, after all, machine learning systems are not human!

Hooke’s Curve, hooking up and dressing sense

So Priyanka and I were talking about a mutual acquaintance, and the odds of her (the acquaintance) being in a relationship, or trying to get into one. I offered “evidence” that this acquaintance (who I meet much more often than Priyanka does) has been dressing progressively better over the last year, and from that evidence, it’s likely that she’s getting into a relationship.

“It can be the other way, too”, Priyanka countered. “Haven’t you seen countless examples of people who have started dressing really badly once they’re in a relationship?”. Given that I had several data points in this direction, too, there was no way I could refute it. Yet, I continued to argue that given what I know of this acquaintance, it’s more likely that she’s still getting into a relationship now.

“I can explain this using Hooke’s Law”, said Priyanka. Robert Hooke, as you know was a polymath British scientist of the seventeenth century. He has made seminal contributions to various branches of science, though to the best of my knowledge he didn’t say anything on relationships (he was himself a lifelong bachelor). In Neal Stephenson’s The Baroque Cycle, for example, Hooke conducts a kidney stone removal operation on one of the protagonists, and given the range of his expertise, that’s not too far-fetched.

“So do you mean Hooke’s Law as in stress is proportional to strain?”, I asked. Priyanka asked if I remembered the Hooke’s Curve. I said I didn’t. “What happens when you keep increasing stress?”, she asked. “Strain grows proportional until it snaps”, I said. “And how does the curve go then”, she asked. I made a royal mess of drawing this curve (didn’t help that in my mind I had plotted stress on X-axis and strain on Y, while the convention is the other way round).

After making a few snide remarks about my IIT-JEE performance, Priyanka asked me to look up the curve and proceeded to explain how the Hooke’s curve (produced here) explains relationships and dressing sense.

“As you get into a relationship, you want to impress the counterparty, and so you start dressing better”, she went on. “These two feed on each other and grow together, until the point when you start getting comfortable in the relationship. Once that happens, the need to impress the other person decreases, and you start wearing more comfortable, and less fashionable, clothes. And then you find your new equilibrium.

“Different people find their equilibria at different points, but for most it’s close to their peak. Some people, though, regress all the way to where they started.

“So yes, when people are getting into a relationship they start dressing better, but you need to watch out for when their dressing sense starts regressing. That’s the point when you know they’ve hooked up”, she said.

By this point in time I was asking to touch her feet (which was not possible since she’s currently at the other end of the world). Connecting two absolutely unrelated concepts – Hooke’s Law and hooking up, and building a theory on that. This was further (strong) confirmation that I’d married right!

Marketing

I’m in a conversation with a friend on marketing my consulting services and he gave me a most genius piece of advice

You can say you do supervised learning instead of saying regressions.

Last month I was at this big data conference. Everyone I met said they were into big data or analytics or some such. The follow up question would always be “and what exactly do you do?” Followed by a laugh about how these are much abused terms.

Numbers and management

I learnt Opeations Research thrice. The first was when I had just finished school and was about to go to IIT. My father had just started on a part-time MBA, and his method of making sure he had learnt something properly was to try and teach it to me. And so, using some old textbook he had bought some twenty years earlier, he taught me how to solve the transportation problem. I had already learnt to solve 2-variable linear programming problems in school (so yes, I learnt OR 4 times then). And my father taught my how to solve 3-variable problems using the Simplex table.

I got quite good at it, but by not using it for the subsequent two years I forgot. And then I happened to take Operations Research as a minor at IIT. And so in my fifth semester I learnt the basics again. I was taught by the highly rated Prof. G Srinivasan. He lived up to his rating. Again, he taught us simplex, transportation and assignment problems, among other things. He showed us how to build and operate the simplex table. It was fun, and surprisingly (in hindsight) never once did I consider it to be laborious.

This time I didn’t forget. OR being my minor meant that I had OR-related courses in the following three semesters, and I liked it enough to even considering applying for a PhD in OR. Then I got cold feet and decided to do an MBA instead, and ended up at IIMB. And there I learnt OR for the fourth time.

The professor who taught us wasn’t particularly reputed, and she lived up to her not-so-particular-reputation. But there was a difference here. When we got to the LP part of the course (it was part of “Quantitative Methods 2”, which included regression and OR), I thought I would easily ace it, given my knowledge of simplex. Initially I was stunned to know that we wouldn’t be taught the simplex. “What do they teach in an OR course if they don’t teach Simplex”, I thought. Soon I would know why. Computer!

We were all asked to install this software called Lindo on our PCs, which would solve any linear programming problem you would throw at it, in multiple dimensions. We also discovered that Excel had the Solver plugin. With programs like these, what use of knowing the Simplex? Simplex was probably useful back in the day when readymade algorithms were not available. Also, IIT being a technical school might have seen value in teaching us the algorithm (though we always solved procedurally. I never remember writing down pseudocode for simplex). The business school would have none of it.

It didn’t matter how the problem was actually solved, as long as we knew how to use the solver. What was more important was the art of transforming a real-life problem into one that could be solved using Solver/Lindo. In terms of formulation, the problems we got in our assignments and exams were  tough – back in IIT when we solved manually such problems were out of bounds since Simplex would take too long on those.

I remember taking a few more quant electives at IIM. They were all the same – some theory would be taught where we knew something about the workings of some of the algorithms, but the focus was on applications. How do you formulate a business problem in a way in which you can use the particular technique? How do you decide what technique you use for what problem? These were some of the questions I learnt to answer through the course of my studies at IIM.

I once interviewed with a (now large) marketing analytics firm in Bangalore. They expected me to know how to measure “feelings” and other BS so I politely declined after one round. From what I understood, they had two kinds of people. First they had experienced marketers who would do the “business end” of the problem. Then they had stats/math grads who actually solved the problem. I think that is problematic. But as I have observed in a few other places, that is the norm.

You have tech guys doing absolutely tech stuff and reporting to business guys who know very little of the tech. Because of the business guy’s disinterest in tech, he is unlikely to get his hands dirty with the data. And is likely to take what the tech guy gives him at face value. As for the tech guy doing the data work, he is unlikely to really understand the business problem that he is solving, and so he invariably ends up solving a “tech problem”, which may or may not have business implications.

There are times when people ask me if I “know big data”. When I reply in the negative, they wonder (sometimes aloud) how I can call myself a data scientist. Then there are times when people ask me about a particular statistical technique. Again, it is extremely likely I answer in the negative, and extremely likely they wonder how I call myself a data scientist.

My answer is that if I deem a problem to be solvable by a particular technique, I can then simply read up on the technique! As long as you have the basics right, you don’t need to mug up all available techniques.

Currently I’m working (for a client) on a problem that requires me to cluster data (yes, I know that much stats to know that now the next step is to cluster). So this morning I decided to read up on some clustering algorithms. I’m amazed at the techniques that are out there. I hadn’t even heard of most of them. Then I read up on each of them and considered how well they would fit my data. After reading up, and taking another look at the data, I made what I think is an informed choice. And selected a technique which I think was appropriate. And I had no clue of the existence of the technique two hours before.

Given that I solve business problems using data, I make sure I use techniques that are appropriate to solve the business problem. I know of people who don’t even look at the data at hand and start implementing complex statistical techniques on them. In my last job (at a large investment bank), I know of one guy who suggested five methods  (supposedly popular statistical techniques – I had never heard of them; he had a PhD in statistics) to attack a particular problem, without having even seen the data! As far as he was concerned he was solving a technical problem.

Now that this post is turning out to be an advertisement for my consulting services, let me go all the way. Yes, I call myself a “management consultant and data scientist”. I’m both a business guy and a data guy. I don’t know complicated statistical techniques, but don’t see the need to know either – since I usually have the internet at hand while working. I solve business problems using data. The data is only an intermediary step. The problem definition is business-like. As is the solution. Data is only a means.

And for this, I have to thank the not-so-highly-reputed professor who taught me Operations Research for the fourth time – who taught me that it is not necessary to know Simplex (Excel can do it), as long as you can formulate the problem properly.

Project Thirty – Closure

Today is the last day of my twenties. Which means Project Thirty has come to an end. I had a long list of things to do, and as the more perceptive of you would have expected from me, most of them are undone. Nevertheless, it has been a mostly positive year, and I’m glad I gave myself the year off in an attempt to find what I want to do.

The biggest positive of the last one year was that my mental illnesses (anxiety, depression, ADHD) got diagnosed and started getting treated. Yes I’m on drugs, and face severe withdrawal symptoms if I don’t take my antidepressant for a few days, but the difference these drugs have made to my life is astounding. I feel young again. I feel intelligent again. I have more purpose in life, and am back at the cocky confidence levels I last saw in 2005. I suddenly feel there’s so much for me to do, and for the first time ever, have started enjoying what I’m doing for money.

Which brings me to professional life. I decided to give myself a year to become a freelancer. I must admit I got one lucky break (one long-term reader of this blog was looking for a data science consultant for his company and I grabbed the opportunity), but I grabbed it. My improved mental state meant that I was motivated enough to do a good job of the pilot project I did for that company, and I have managed to extract what I think is a reasonable compensation for my consulting services.

There are other exciting opportunities on the horizon on the professional front, too. I’ve started teaching at Takshashila and am quite liking it (I hope my students are, too). There is so much opportunity staring at me right now that the biggest problem for me is one of prioritization rather than looking for opportunity.

There has been both progression and regression on the “extra curricular activities” front. Thanks to demands of my consulting assignment, I haven’t been getting time to practice the violin and abruptly discontinued classes two months ago. I did one awesome and rejuvenating bike trip across Rajasthan back in February but wasn’t able to follow that up even with weekend trips. I wanted to start on adventure sports but that remained a non-starter. I started preparing for a half-marathon and gave up in a month. I took a sports club membership, tried to teach myself swimming again, but have been irregular.

Personal life again has been mixed. Increasing excitement about work means less time for the family, and have been finding it hard to balance the time requirements. I seem to be putting on weight again, and now look closer to the monstrosity I was four years ago rather than the fit guy I was two years ago at the time of my wedding. I blame my expanding waistline and neckline on my travel, but that is not an excuse and I need to find an exciting way to get fit soon.

For perhaps the first time in several years my car didn’t take a knock that year, but I had two motorcycling accidents (one major and one minor) this year. The former led to the first ever broken bone in my body (the fifth metacarpal) thanks to which I don’t have a prominent fourth knuckle on my right hand. The latter led to major damages to my laptop.

My “studs and fighters” book still remains unwritten, and not a word has been added to its manuscript in the last one year. I was hoping to capstone my Project Thirty by organizing the first ever “NED Talks” but I seem to have bitten off much more than I can chew in terms of work, so that has again been postponed.

So let me take this opportunity to define my Project Thirty One. I want at least two published books by the end of the year. I want to do at least one major motorcycling trip. I need to find partners/employees and expand my consulting business. I want to travel a lot more – at least five weekend trips over the next 12 months. I want to become fit, to the size I was at the time of my wedding. Hopefully I can get weaned off anti-depressants. And I hope to resume music lessons, and start jamming. Ok let me not promise myself too much.

And I have a five-year plan too. By the time I’m thirty five, I want to have written a book on the economic history of India. Ambitious, I know. Especially for an NED Fellow like me.