Goodhart’s Law and getting beaten on the near post

I would have loved to do this post with data but I’m not aware of any source from where I could get data for this over a long period of time. Recent data might be available with vendors such as Opta, but to really test my hypothesis we will need data from much farther back – from the times when few football games were telecast, let alone “tagged” by a system like Opta. Hence, in this post I’ll simply stick to building my hypothesis and leave the testing for an enterprising reader who might be able to access the data.

In association football, it is more likely for an attacker to have a goalscoring opportunity from one side rather than from straight ahead. Standing between the attacker and the net is the opposing goalkeeper, and without loss of generality, the attacker can try to score on either side of the goalkeeper. Now, because of the asymmetry in the attacker’s position, these two sides of the goalkeeper can be described as “near side” and “far side”. The near side is the gap between the goalkeeper and the goalpost closest to the attacker. The far side is the gap between the goalkeeper and the goalpost on the farther side.

Red dot is goalkeeper, blue dot is striker.


However, my hypothesis is that this has not been the case recently. For a while now (my football history is poor, so I’m not sure since when) it has been considered shameful for a goalkeeper to be “beaten at the near post”. The argument has been that given the short distance between himself and the near post, the goalie has no business in letting in the ball through that gap. Commentators and team selectors have been more forgiving of the far post, though. The gap there is large enough, they say, that the chances of scoring are high anyway, so it is okay if a goalie lets in a goal on that side.

Introductory microeconomics tells us that people respond to incentives. Goodhart’s Law states that

When a measure becomes a target, it ceases to be a good measure.

So with it becoming part of the general discourse that it is shameful for a goalkeeper to be beaten on the near side, and that selectors and commentators are more forgiving to goals scored on the far side, goalkeepers have responded to the changed incentives. My perception and hypothesis is that with time goalkeepers are positioning themselves closer to their near post, and thus leaving a bigger gap towards the far post. And thus, they are not any more optimizing to minimize the total chance of scoring a goal.

But isn’t it the same thing? Isn’t it possible that the optimal position of the goalkeeper for stopping a shot be the same as that of stopping a shot on the near side? The answer is an emphatic no.

Let us refer to the above figure once again. Let us assume that the chance of scoring when the angle is theta be f(theta). Now, we can argue that this is a super-linear function. That is, if theta increases by 10%, the chances of scoring increase by more than 10%. Again we could use data to prove this but I think it is mathematically intuitive. Given that f(theta) is super-linear, what this means is that 1. The function is strictly increasing, and 2. The derivative f'(theta) is also strictly increasing.

So, going by the above figure, the goalkeeper needs to minimize f(theta_1) + f(theta_2). If the total angle available is theta (= theta_1 + theta_2), then the goalkeeper needs to minimize f(theta_1) + f(theta - theta_1). Taking first derivative and equating it to zero we get,

f'(theta_1) = f'(theta - theta_1)

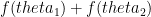
Because f is a super-linear function, we had argued earlier that its derivative is strictly increasing. Thus, the above equality implies that theta_1 = theta - theta_1 or theta_1 = theta_2 or f(theta_1) = f(theta_2).

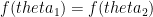
Essentially, if the goalkeeper positions himself right, there should be an equal chance of getting beaten on the near and far posts. However, given the stigma attached to being beaten on the near post, he is likely to position himself such that theta_1 < theta_2, and thus increases the overall chance of getting beaten.

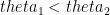
It would be interesting to look at data (I’m sure Opta will have this) of different goalkeepers and the number of times they get beaten on the near and far posts. If a goalie is intelligent, these two numbers should be equal. How good the goalkeeper is, however, determined by the total odds of scoring a goal past him.

Goalkeeper Mishmash

So one of the comments on my previous post about goalkeepers talked about how the relegated teams (Wolves, Bolton and Blackburn) had the worst keepers. So I wondered how they would have done had they had better goalies. I’ve still not figured out how to correlate a goalie’s distribution success to goals scored and so I’ll simply stick to shot stopping criteria.

I use the ratio of big chances to goals in each game to figure out how a different goalkeeper would have reacted. So if I have a goalie with a 90% shot-stopping ability and the opposing team has 10 big chances in the game, then I concede 1 goal. However, if my goalie has a 50% stopping ability I let in 5.

Based on the shot-stopping success ratio of each goalkeeper and the number of big chances faced by each team in each game, I have estimated the number of goals the team would have let in in each game. Comparing this against goals scored, I have come up with a hypothetical points tally for the season.

I know I abuse excel graphics a lot but I couldn’t think of any non-excel method to present the data here. I paired each goalie who played at least 1000 minutes during the season with each team and estimated how many points the team would have raked up.

Goalie Mishmash

Some pertinent observations.

1. The teams on whom the quality of goalie had the most impact are Arsenal, Blackburn, Wigan and Wolves. This goes to show how much Arsenal have to credit Sczsesny for their ability to reach the Champions’ League.

2. Everton is the team where the maximum and minimum possible points due to change in goalie is minimum (4, opposed to 14 for Arsenal). Shows that they have a pretty compact and tight defence, and what stops them from a top four slot is the quality of attack.

3. Due to the low number of big chances that occur in each game and due to rounding of goals conceded, you see some kind of a discontinuity in scores as you go down the list, as well as lots of ties. There is no mistake in the data or the calculations.

4. Manchester United has a much lower “goalkeeper impact” than Manchester City. With a lesser goalie than Joe Hart, it is unlikely City would have won the title.

5. Since we use overall averages of a goalie’s shot stopping ability, these simulations show different numbers for “real” goalie-team pairs than what the teams actually achieved.

6. The difference in maximum and minimum possible points as a function of a goalkeeper is a good indication of the overall quality of a team’s defense. The table below ranks the teams as per quality of defense.

defencequality

7. While Blackburn and Wolves both had poor defence, part of Bolton’s relegation blame can be attributed to the quality (or otherwise) of their goalkeepers (Adam Bogdan and Juusi Jaaskaleinen). Which makes it even more surprising that West Ham (upon re-entry to the Premier League) sold Robert Green (to QPR, where he warms the bench) and recruited Jaaskaleinen in his place.

8. Last season, Liverpool had a pretty good defence (especially their first-choice back four of Johnson-Skrtel-Agger-Enrique). Their attacking ability (and especially their finishing – same story this season) let them down badly.