Why I never became a pundit

It’s been nearly a decade since i started writing in the mainstream media. Ahead of the Karnataka elections in 2013, I had published on this blog a series of quantitative analyses of the election, when R Sukumar (then editor-in-chief of Mint) picked it up and asked me if I could write for his paper on the topic – quantitative analysis of elections.

And so Election Metrics (what my pieces in Mint – they were analysis and not editorials, which meant it wasn’t a strict “column” per se, but I got paid well) was born. I wrote for Mint until the end of 2018, when my then contract ran out and Sukumar’s successor chose not to renew.

Having thus “cracked print”, I decided that the next frontier had to be video. I wanted to be on TV, as a pundit. That didn’t come easily. The 2014 national elections (when Modi first became PM) came and went, and I spent the counting day in the Mint newsroom, far from any television camera. I tried to get my way in to IPL auction analysis, but to no avail.

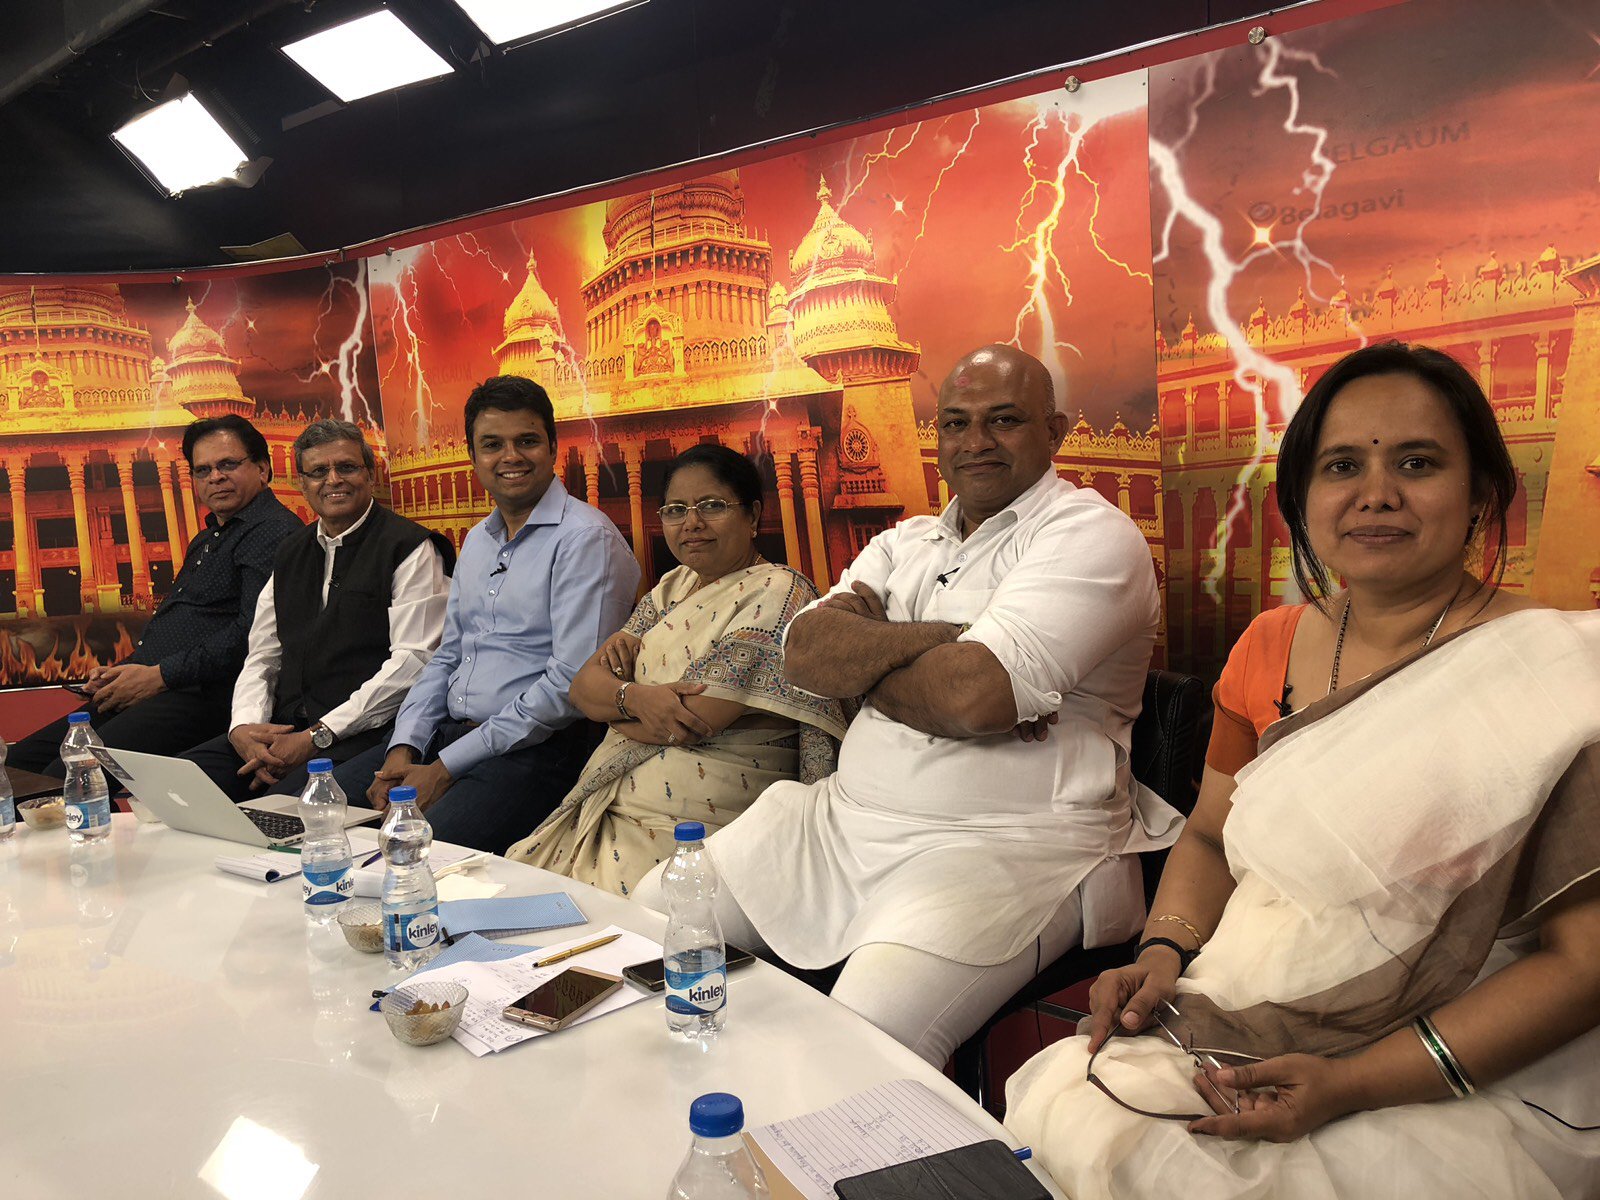
Finally, in 2018, on the day of the Karnataka elections, I got one guy I knew from way back to arrange for a TV appearance, and went on “News9” (a Bangalore-focussed English news channel) to talk about exit polls.

“I saw the video you had put on Facebook”, my friend Ranga said when he met me a few days later, “and you were waxing all eloquent about sample sizes and standard errors”. On that day I had been given space to make my arguments clear, and I had unleashed the sort of stuff you don’t normally see on news TV. Three days later, I got invited on the day of counting, enjoyed myself far less, and that, so far, has been the end of my career in punditry.

Barring a stray invitation from The Republic aside, my career in TV punditry has never gotten close to getting started after that. Of late I haven’t bothered, but in the past it has frequently rankled, that I’ve never been able to “crack TV”. And today I figured out why.

On my way to work this morning I was listening to this podcast featuring noted quant / factor investors Jim O’Shaughnessy and Cliff Asness. It was this nice episode where they spoke about pretty much everything – from FTX and AMC to psychedelics. But as you might expect with two quant investors in a room, they spent a lot of time talking about quantitative investing.

And then somewhere they started  talking about their respective TV appearances. O’Shaughnessy started talking about how in the early days of his fund, he used to make a lot of appearances on Bloomberg and CNBC, but of late he has pretty much stopped going.

He said something to the effect of: “I am a quant. I cannot give soundbites. I talk in terms of stories and theories. In the 80s, the channels used to give me a minute or two to speak – that was the agreement under which I appeared on them. But on my last appearance, I barely got 10 seconds to speak. They wanted soundbites, but as a quant I cannot give soundbites”.

And then Asness agreed, saying pretty much the same thing. That it was okay to go on television in the time when you got a reasonable amount of time to speak, and build a theory, and explain stuff, but now that television has come down to soundbites and oneliners, he is especially unsuited to it. And so he has stopped going.

There it was – if you are the sort who is driven by theories, and you need space to explain, doing so over voice is not efficient. You would rather write, where there is room for constructing an argument and making your point. If you were to speak, unless you had a lot of time (remember that speaking involves a fair amount of redundancy, unlike writing), it would be impossible to talk theories and arguments.

And I realise I have internalised this in life as well – at work for example, I write long emails (in a previous job, colleagues used to call them “blogposts”) and documents. I try to avoid complicated voice discussions – for with my laborious style I can never win them. Better to just write a note after it is over.

Confusing with complications

I’m reading this awesome article by Srinivas Bhogle (with Rajeeva Karandikar) on election forecasting. To be fair, not much of the article is new to me – it’s just a far more readable version of Karandikar’s seminal presentation on the topic made at IIT Kanpur all those years back.

However, as with all good retellings, this story also has some nice tidbits. This one has to do with “index of opposition unity”. The voice here is Bhogle’s:

It is easy to understand why the IOU becomes so critical in such situations. But, and here’s the rub, the exact mathematical formula connecting IOU to the seat count prediction is not easy to find. I searched through the big and small print of The Verdict by Dorab Sopariwala and Prannoy Roy, but the formula remained elusive.

Rajeeva suggests that it was likely based on simple heuristics: something like ‘if the IOU is less than 25%, give the first-placed party 75% of the seats.’ It may also have involved intelligent tweaking based on current survey data, historical data, informal feedback, expert opinion, gut feeling, and so on.

I first came across the IOU in Prannoy Roy and Dorab Sopariwala’s book. The way they had presented in the book, it seemed like it is a “major concept”. It seems, like I did, Bhogle also looked through the book trying to find a precise formula, and failed to do so.

And then Karandikar’s insight above is crucial – that the IOU may not be a precise mathematical formula, but just an intelligent set of heuristics, involving intelligent tweaking.

Sometimes putting a fancy name (or, even better, an acronym) on something can help lend credibility to the concept. For example, IOU is something that has been championed by Roy and Sopariwala for years, and they have done so to a level where it has become a self-fulfilling prophecy, and a respected scientist for Bhogle has gone searching for its formula!

Also, sometimes, telling people that you “used an intelligent heuristic” to come up with a conclusion can lead you to be taken less seriously. Put on a fancy name (even if it is something that you have yourself come up with), and the game changes. You suddenly start to be taken more seriously, like Ganesha assumed when he started sending fan mail under the name “YG Rao”.

And like they say in The Usual Suspects, sometimes the greatest trick that the devil ever pulled was to convince you that he exists. It is the same with “concepts” such as IOU – you THINK they must be sound because they come with a fancy name, when all that they apeear to represent is a set of fancy heuristics.

I must say this is excellent marketing.

Finite and infinite games, and questioning elections

I came across this snippet of an interview of Dr. S Jaishankar, India’s foreign minister.


In this, among other things, he says that “in India, nobody questions an election” (in the context of some reports that India is not really a democracy).

This can be simply explained by the concept of finite and infinite games, something I’ve spoken here about for a long time now, ever since I read the book of the same name by James Carse.

In general, in a stable democracy, parties don’t question election results because they know that the only way they can get back to power at a later point in time is by winning a similar election. In other words, if a party that loses an election were to question its legitimacy, it’s own victory in a subsequent election can be similarly undermined.

In other words, in a stable democracy, parties play an infinite game, where the potential short-term benefit of questioning an election gets trumped by the long-term benefit of using the same apparatus for winning subsequent elections.

So what explains America and Donald Trump’s questioning of the elections?

Notice that above, I said that “parties play an infinite game”. Individual politicians, on the other hand, can also play finite games. Given his age, Trump pretty much knew that the 2020 election (that he lost to Biden) was likely going to be his last. If he lost these elections (as he did), he would be out of power for the rest of his life. And so it made sense to him to question the results.

I’m pretty sure that the Republican party establishment (or whatever is left of it) wouldn’t have wanted to question the election, because as a party they are playing an infinite game, and what they need is the same election apparatus to come back to power next time round, or some time in the future.

The difference, in this regard, between India and the US, is the form of government. In a parliamentary system (at least in theory), and one with anti-defection laws, the party is supreme. However much a leader tries, he can never be superior to the party. And so the party’s incentives (infinite game) trump’s the leader’s (possibly finite game), and elections are not questioned.

The presidential system in the US means the leader trumps the party, at least within an election cycle, and so Trump’s finite game trumped the Republican party’s infinite game, and the results were questioned.

Opinion polling in India and the US

(Relative) old-time readers of this blog might recall that in 2013-14 I wrote a column called “Election Metrics” for Mint, where I used data to analyse elections and everything else related to that. This being the election where Narendra Modi suddenly emerged as a spectacular winner, the hype was high. And I think a lot of people did read my writing during that time.

In any case, somewhere during that time, my editor called me “Nate Silver of India”.

I followed that up with an article on why “there can be no Nate Silver in India” (now they seem to have put it behind a sort of limited paywall). In that, I wrote about the polling systems in India and in the US, and about how India is so behind the US when it comes to opinion polling.

Basically, India has fewer opinion polls. Many more political parties. A far more diverse electorate. Less disclosure when it comes to opinion polls. A parliamentary system. And so on and so forth.

Now, seven years later, as we are close to a US presidential election, I’m not sure the American opinion polls are as great as I made them out to be. Sure, all the above still apply. And when these poll results are put in the hands of a skilled analyst like Nate Silver, it is possible to make high quality forecasts based on that.

However, the reporting of these polls in the mainstream media, based on my limited sampling, is possibly not of much higher quality than what we see in India.

Basically I don’t understand why analysts abroad make such a big deal of “vote share” when what really matters is the “seat share”.

Like in 2016, Hillary Clinton won more votes than Donald Trump, but Trump won the election because he got “more seats” (if you think about it, the US presidential elections is like a first past the post parliamentary election with MASSIVE constituencies (California giving you 55 seats, etc.) ).

And by looking at the news (and social media), it seems like a lot of Americans just didn’t seem to get it. People alleged that Trump “stole the election” (while all he did was optimise based on the rules of the game). They started questioning the rules. They seemingly forgot the rules themselves in the process.

I think this has to do with the way opinion polls are reported in the US. Check out this graphic, for example, versions of which have been floating around on mainstream and social media for a few months now.

This shows voting intention. It shows what proportion of people surveyed have said they will vote for one of the two candidates (this is across polls. The reason this graph looks so “continuous” is that there are so many polls in the US). However, this shows vote share, and that might have nothing to do with seat share.

The problem with a lot (or most) opinion polls in India is that they give seat share predictions without bothering to mention what the vote share prediction is. Most don’t talk about sample sizes. This makes it incredibly hard to trust these polls.

The US polls (and media reports of those) have the opposite problem – they try to forecast vote share without trying to forecast how many “seats” they will translate to. “Biden has an 8 percentage point lead over Trump” says nothing. What I’m looking for is something like “as things stand, Biden is likely to get 20 (+/- 15) more electoral college votes than Trump”. Because electoral college votes is what this election is about. The vote share (or “popular vote”, as they call it in the US (perhaps giving it a bit more legitimacy than it deserves) ), for the purpose of the ultimate result, doesn’t matter.

In the Indian context, I had written this piece on how to convert votes to seats (again paywalled, it seems like). There, I had put some pictures (based on state-wise data from general elections in India before 2014).

An image from my article for Mint in 2014 on converting votes to seats. Look at the bottom left graph

What I had found is that in a two-cornered contest, small differences in vote share could make a massive difference in the number of seats won. This is precisely the situation that they have in the US – a two cornered contest. And that means opinion polls predicting vote shares only should be taken with some salt.

TV Punditry

Those of you who might be following me on social media (Twitter/Facebook/LinkedIN) might know that I’ve started a career in TV Punditry over the last week. Well, it’s not that much of a career – I still need to figure out how to get paid for it.

Anyway, so I was on News9 once on Saturday (analysing exit polls) and again on Tuesday (analysing the election results). It happened pretty much at random, from a random twitter conversation:

And so Mathang (who I’d first met in 2004 when he had interviewed me for Education Times) set me up with Anil Kumar from News9, who presently asked me for my number. A couple of twitter DMs, a couple of emails and a couple of phone calls later, I had been asked to come to the News9 studio at 5pm on Saturday.

Saturday’s session was really enjoyable, and I spoke a fair bit on the process of conducting an exit poll, the importance of sample sizes and representative samples, the process of converting votes to seats, etc. A 5 minute monologue on sampling process got the anchors interested in me, and they kept coming back to me. As is my wont, I summarised the import of my arguments for Mint.

And so I got invited again for Tuesday’s post-counting session, and I’m not sure I enjoyed it that much. As the elections threw up a hung assembly, the politicians on the panel spent their time shouting at each other. I was seated in an inappropriate place – right between a loud JDS spokesperson and a loud BJP spokesperson. I recused myself from much of the discussion and was only brought in because the anchors probably thought I should be “given some lines” – an opportunity I used to comment on the parties’ election strategies.

So two TV appearances later, I must say I quite like the format – it’s good footage (literally) if not anything else, but it can be a bit painful. Writing is easy in the sense that you just collect your thoughts and deliver them at a time.

Video means that you are virtually participating in a group discussion, and need to butt in to make your point. You might have something insightful to say, but need to wait for an opportune time to interject. You might be in the middle of a long point but get interrupted by another panellist. You might wait for ages to say something but the opportunity never comes. At other times, you might get a question that you’re not prepared for.

The worst thing as an analytical guy on TV is that you need to keep referring to your data, and your analysis. So there was one occasion on each session when the anchors asked me a question to answer which I’d to write some code to answer. So each time I mumbled something and bent down to my laptop, and got bailed out by the anchor who got someone else’s view in the time I took to get the requisite data.

In any case, I want to do more of this. I also hope that like with my writing, I can some day hope to get paid for TV appearances – this is a hard job since panellists representing political parties don’t charge anything – it’s in their parties’ interests to be represented on the show.

But, some day..

Opinion polls and betting

So for a change the opinion polls seem to have got it right. I’m talking about the just-concluded elections in the UK here, which has returned a hung parliament. The Tories have fallen just sort of a majority (in Kannada we’d call it “AJM“). It’ll be interesting to see how a government will be formed now.

Now, the thing is that the opinion polls got it right. While the Tories had started off with a big lead at the time the elections were announced, opinion polls over time showed that the race was getting a lot tighter. I’d piggybacked on the opinion polls to conduct my own analysis which got published in Mint.

Having shown off that I’d made the prediction correctly, let me get to my hypothesis of why the opinion polls got it right. Opinion polls in the UK have a greater chance of being right because because betting is legal here.

I was walking around Central London yesterday when I saw this poster outside a betting shop.

Because betting is legal in the UK, betting houses take bets on just about anything, including the results of elections. The way betting works is that the betting houses make markets. They present odds for each side of the deal (in this case, let’s say Tory win, Labour win and hung parliament), and whenever a punter walks into the shop and places a bet, it’s the house that’s taking the opposite side of the bet.

What this implies is that the house better get the odds right, otherwise the difference in their odds and the actual results can wipe out the shop. And how does the betting house know where to set the odds? For something like an election, they rely on the opinion polls.

If the opinion polls get it wrong, the betting houses can end up losing a lot of money (like they evidently did last year during the Brexit vote which most pollsters got horribly wrong). So there is a legal entity which has real skin in the game in opinion polls being right.

I’m not sure of the ownership of the opinion polling companies here in the UK, but I won’t be surprised if they make plenty of money by selling their results to betting shops (at a more granular level than what they make public). And given the intense competition among pollsters here in the UK (at least 15 different agencies conducted opinion polls ahead of yesterday’s elections), there is a real incentive for a pollster to get it right – get it wrong and the betting houses might take their business elsewhere.

In case betting wasn’t legal (such as in India), polling agencies wouldn’t be able to legally sell their results to betting houses and punters, and their markets would be limited to media houses. Media houses don’t have that much of a skin in the game in the polls – their profits don’t depend on getting polls right as much as the profits of betting houses. And pollsters would have less incentive to get the polls right.

Now, howzzat?


When I missed my moment in the sun

Going through an old piece I’d written for Mint, while conducting research for something I’m planning to write, I realise that I’d come rather close to staking claim as a great election forecaster. As it happened, I just didn’t have the balls to stick my neck out (yes, mixed metaphors and all that) and so I missed the chance to be a hero.

I was writing a piece on election forecasting, and the art of converting vote shares into seat shares, which is tricky business in a first past the post system such as India. I was trying to explain how the number of “corners of contests” can have an impact on what seat share a particular vote share can translate to, and I wrote about Uttar Pradesh.

Quoting from my article:

An opinion poll conducted by CNN-IBN and CSDS whose results were published last week predicted that in Uttar Pradesh, the Bharatiya Janata Party is likely to get 38% of the vote. The survey reported that this will translate to about 41-49 seats for the BJP. What does our model above say?

If you look at the graph for the four-cornered contest closely (figure 4), you will notice that 38% vote share literally falls off the chart. Only once before has a party secured over 30% of the vote in a four-cornered contest (Congress in relatively tiny Haryana in 2004, with 42%) and on that occasion went on to get 90% of the seats (nine out of 10).

Given that this number (38%) falls outside the range we have noticed historically for a four-cornered contest, it makes it unpredictable. What we can say, however, is that if a party can manage to get 38% of the votes in a four-cornered state such as Uttar Pradesh, it will go on to win a lot of seats.

As it turned out, the BJP did win nearly 90% of all seats in the state (71 out of 80 to be precise), stumping most election forecasters. As you can see, I had it all right there, except that I didn’t put it in that many words – I chickened out by saying “a lot of seats”. And so I’m still known as “the guy who writes on election data for Mint” rather than “that great election forecaster”.

Then again, you don’t want to be too visible with the predictions you make, and India’s second largest business newspaper is definitely not an “obscure place”. As I’d written a long time back regarding financial forecasts,

…take your outrageous prediction and outrageous reasons and publish a paper. It should ideally be in a mid-table journal – the top journals will never accept anything this outrageous, and you won’t want too much footage for it also.

In all probability your prediction won’t come true. Remember – it was outrageous. No harm with that. Just burn that journal in your safe (I mean take it out of the safe before you burn it). There is a small chance of your prediction coming true. In all likelihood it wont, but just in case it does, pull that journal out of that safe and call in your journalist friends. You will be the toast of the international press.

So maybe choosing to not take the risk with my forecast was a rational decision after all. Just that it doesn’t appear so in hindsight.

Analysing the BBMP Elections

The Bruhat Bengaluru Mahanagara Palike (BBMP) went to polls on Saturday, and votes were counted today. The BJP has retained its majority in the house, winning 100 out of 198 available seats. While this is a downer compared to the 113 seats they had won in the previous elections in 2010, the fact that they have won despite being in opposition in the state is a significant achievement.

Based on data put out by Citizen Matters, here is some rudimentary analysis. The first is a choropleth of where each party has performed. Note that this is likely to be misleading since constituencies with large areas are over-represented, but this can give you a good picture.

blrelec
Red: BJP Green: Congress Cyan: JD(S) Blue: Independents Black: Others

Notice that there are a few “bands” where the BJP has performed really well. There is the south-western part of the city that it has literally swept, and it has done well in the south-eastern and northern suburbs, too. And the party hasn’t done too well in the north-west, the traditional “cantonment” area.

We can get a better picture of this by looking at the choropleths by assembly constituency. These shapes might be familiar to regular readers of the blog since I’d done one post on gerrymandering.

blrelec2

This tells you where each party has done well. As was evident from the first figure, the BJP has done rather well in Basavanagudi, Jayanagar and Padmanabhanagar in “traditional South Bangalore” and blanked out in Pulakeshi Nagar in the cantonment. In fact, if you try to correlate these results with that of the last Assembly elections, the correlation is rather strong. Most constituencies have gone the way of the assembly segments they are part of.

Then there is the issue of reservation – there were a lot of murmurs that the Congress party which is in power in the state changed the reservations to suit itself. Yet, there are a few interesting factoids that indicate that the new set of reservations were rather logical.

The next two graphs show the distribution of SC and ST populations respectively as a function of the reservations of the constituencies (population data from http://openbangalore.org).

Rplot03 Rplot02Notice that the constituencies reserved for SCs and STs are among those that have the highest SC and ST populations respectively. The trick in gerrymandering was in terms of distributions between general and OBC constituencies, and among women.

I could put the performance of different parties by reservation categories, and on whether the reservation of a constituency has changed has any effect on results, but (un)fortunately, there aren’t any trends, and consequently there is little information content. Hence I won’t bother putting them in.

Nevertheless, these have been extremely interesting elections. All the postponement, all the drama and court case, and finally the underdog (based on previous trends) winning. Yet, given the structure of the corporation, there is little hope that much good will come of the city in the coming years. And there is nothing in the election results that can alter this.


Understanding the by-election results

Kindly note that this post falls under the category of “political gossip” and not under the category of “policy analysis” that this blog is mostly filled with

So the BJP has got trounced in the by elections that were counted yesterday. People have been quick to call this a referendum on Modi’s government and are asking him to change course (each commentator is calling for a change of course in a different direction – possibly with the vector sum of them being nothing). I got an email this morning asking for reasons of the BJP’s poor performance and this is what I wrote back:

So in that one vote that you have, you need to collectively express a range of emotions – like which party you want to form the government, who you want the prime minister to be, who will take best care of your community in your constituency, who is the best person to represent your constituency in the assembly, which local person you can  turn to in times of trouble, etc. (it’s a very long list). So your vote is essentially a weighted average of your emotions in all these aspects.
In the elections in May, thanks to the non-existence of a government for a very long time, the weights given to a stable and strong government at the centre and choice of prime minister shot up. Like crazy. And it was clear before the elections that there was only one party and one man who could offer this kind of a government.
Since the weight given to this factor in the minds of people was so high, it trumped everything else, and even the proverbial lamppost on a BJP ticket (especially in Uttar Pradesh) managed to get elected! And thus we got a party with full majority. And we got the desired man as PM. And we will most likely have a stable  government for the next five years.
A bypoll is different – especially when you have a small number of by polls they simply don’t affect who forms the government and who the prime minister should be. Thus, the weight given to those elements of the vector, which were extremely high in May,were set to zero. Thanks to that, people voted based on the other components – like caste, local dominance, community support and all that. In that respect I’m not surprised at all in terms of the result.
Also it’s not fair to compare the performance in these bye-elections to the party performance in the respective assembly segments in the lok sabha elections. What we should compare these bypolls to is to the parties that held these seats before they fell vacant. The media has once again succeeded in distorting the narrative to come to hopefully desired conclusions?