The Science in Data Science

The science in “data science” basically represents the “scientific method”.

It’s a decade since the phrase “data scientist” got coined, though if you go on LinkedIn, you will find people who claim to have more than two years of experience in the subject.

The origins of the phrase itself are unclear, though some sources claim that it came out of this HBR article in 2012 written by Thomas Davenport and DJ Patil (though, in 2009, Hal Varian, formerly Google’s Chief Economist had said that the “sexiest job of the 21st century” will be that of a statistician).

Some of you might recall that in 2018, I had said that “I’m not a data scientist any more“. That was mostly down to my experience working with companies in London, where I found that data science was used as a euphemism for “machine learning” – something I was incredibly uncomfortable with.

With the benefit of hindsight, it seems like I was wrong. My view on data science being a euphemism for machine learning came from interacting with small samples of people (though it could be an English quirk). As I’ve dug around over the years, it seems like the “science” in data science comes not from the maths in machine learning, but elsewhere.

One phenomenon that had always intrigued me was the number of people with PhDs, especially NOT in maths, computer science of statistics, who have made a career in data science. Initially I dismissed it down to “the gap between PhD and tenure track faculty positions in science”. However, the numbers kept growing.

The more perceptive of you might know that I run a podcast now. It is called “Data Chatter“, and is ten episodes old now. The basic aim of the podcast is for me to have some interesting conversations – and then release them for public benefit. Yeah, yeah.

So, there was this thing that intrigued me, and I have a podcast. I did what you would have expected me to do – get on a guest who went from a science background to data science. I got Dhanya, my classmate from school, to talk about how her background with a PhD in neuroscience has helped her become a better data scientist.

It is a fascinating conversation, and served its primary purpose of making me understand what the “science” in data science really is. I had gone into the conversation expecting to talk about some machine learning, and how that gets used in academia or whatever. Instead, we spoke for an hour about designing experiments, collecting data and testing hypotheses.

The science in “data science” basically represents the “scientific method“. What Dhanya told me (you should listen to the conversation) is that a PhD prepares you for thinking in the scientific method, and drills into you years of practice in it. And this is especially true of “experimental” PhDs.

And then, last night, while preparing the notes for the podcast release, I stumbled upon the original HBR article by Thomas Davenport and DJ Patil talking about “data science”. And I found that they talk about the scientific method as well. And I found that I had talked about it in my newsletter as well – only to forget it later. This is what I had written:

Reading Patil and Davenport’s article carefully suggests, however, that companies might be making a deliberate attempt at recruiting pure science PhDs for data scientist roles.

The following excerpts from the article (which possibly shaped the way many organisations think about data science) can help us understand why PhDs are sought after as data scientists.

  • Data scientists’ most basic, universal skill is the ability to write code. This may be less true in five years’ time (Ed: the article was published in late 2012, so we’re almost “five years later” now)
  • Perhaps it’s becoming clear why the word “scientist” fits this emerging role. Experimental physicists, for example, also have to design equipment, gather data, conduct multiple experiments, and communicate their results.
  • Some of the best and brightest data scientists are PhDs in esoteric fields like ecology and systems biology.
  • It’s important to keep that image of the scientist in mind—because the word “data” might easily send a search for talent down the wrong path

Patil and Davenport make it very clear that traditional “data analysts” may not make for great data scientists.

We learn, and we forget, and we re-learn. But learning is precisely what the scientific method, which underpins the “science” in data science, is all about. And it is definitely NOT about machine learning.
How Python swallowed R

A week ago, I put a post on LinkedIn saying if someone else working in analytics / data science primarily uses R for their work, I would like to chat.

I got two responses, one of which was from a guy who strictly isn’t in analytics / data science, but needs to analyse large amounts of data for his work. I had a long chat with the other guy today.

Yesterday I put the same post on Twitter, and have got a few more responses from there. However, it is staggering. An overwhelming majority of data people who I know work in Python. One of the reasons I put these posts was to assure myself that I’m not alone in using R, though the response so far hasn’t given me too much of an assurance.

So why do most companies end up using Python for analytics, even when R is clearly better for things like data wrangling, reporting, visualisation, dashboarding, etc.? I have a few theories on this, and I think all of them come together to result in python having its “overwhelming marketshare” (at least among people I know).

Tech people clearly prefer python since it’s easier to integrate. So the tech leaders request the data science leaders to use Python, since it is much easier for the tech people. In a lot of organisations, data science reports into tech, so this request is honoured.

Even if it isn’t, if you recall, “data scientists” are generally tech facing rather than business facing. This means that the models they build need to be codified, and added to the company’s code base. This means necessarily working together with tech, and this means using a programming language that tech is comfortable with.

Then, this spills over. Usually, someone has the bright idea that the firm shouldn’t use two languages for what is essentially the same thing. And so the analytics people are also forced to use python for their analytics, even if it isn’t built for the purpose. And then it spreads.

Next is the “cool factor”. There is this impression that the more technical a solution is, the more superior it is, even if it has no direct business impact (an employer had once  told me, “I have raised money saying we are using machine learning. If our investors see the algorithms you’re proposing, they’ll want their money back”).

So a youngster getting into data wants to do “all the latest stuff”. This means machine learning. Deep learning. Reinforcement learning. And all that. There is an impression that this kind of work is “better work” compared to let’s say generating business insights using data. And in general, the packages for machine learning have traditionally been easier in Python than they are in R (though R is fast catching up, and in general python is far behind R when it comes to user friendliness).

Then, the growth in data and jobs associated with it such as machine learning or data engineering have meant that a lot of formerly tech people have got into data work. Python is fundamentally a programming language, with a package (pandas) added on to do data work. Techies find it far more intuitive than R, which is fundamentally a statistical software. On the other hand, people who are coming from a business / Excel background find it far more comfortable to use R. Python can be intimidating (I fall in this bucket).

So yeah – the tech integration, the number of tech people who are coming into data and the “cool factor” associated with the more techie stuff means that Python is gaining, at R’s expense (in my circle at least).

In any case I’m going to continue to use R. I’m at least 10X faster in R than I am in Python, and having used R for 12 years now, I’m too used to that way of working to change things up.

Statistical analysis revisited – machine learning edition

Over ten years ago, I wrote this blog post that I had termed as a “lazy post” – it was an email that I’d written to a mailing list, which I’d then copied onto the blog. It was triggered by someone on the group making an off-hand comment of “doing regression analysis”, and I had set off on a rant about why the misuse of statistics was a massive problem.

Ten years on, I find the post to be quite relevant, except that instead of “statistics”, you just need to say “machine learning” or “data science”. So this is a truly lazy post, where I piggyback on my old post, to talk about the problems with indiscriminate use of data and models.

I had written:

there is this popular view that if there is data, then one ought to do statistical analysis, and draw conclusions from that, and make decisions based on these conclusions. unfortunately, in a large number of cases, the analysis ends up being done by someone who is not very proficient with statistics and who is basically applying formulae rather than using a concept. as long as you are using statistics as concepts, and not as formulae, I think you are fine. but you get into the “ok i see a time series here. let me put regression. never mind the significance levels or stationarity or any other such blah blah but i’ll take decisions based on my regression” then you are likely to get into trouble.

The modern version of this is – everybody wants to do “big data” and “data science”. So if there is some data out there, people will want to draw insights from it. And since it is easy to apply machine learning models (thanks to open source toolkits such as the scikit-learn package in Python), people who don’t understand the models indiscriminately apply it on the data that they have got. So you have people who don’t really understand data or machine learning working with those, and creating models that are dangerous.

As long as people have idea of the models they are using, and the assumptions behind them, and the quality of data that goes into the models, we are fine. However, we are increasingly seeing cases of people using improper or biased data and applying models they don’t understand on top of them, that will have impact that affect the wider world.

So the problem is not with “artificial intelligence” or “machine learning” or “big data” or “data science” or “statistics”. It is with the people who use them incorrectly.


I’m not a data scientist

After a little over four years of trying to ride a buzzword wave, I hereby formally cease to call myself a data scientist. There are some ongoing assignments where that term is used to refer to me, and that usage will continue, but going forward I’m not marketing myself as a “data scientist”, and will not use the phrase “data science” to describe my work.

The basic problem is that over time the term has come to mean something rather specific, and that doesn’t represent me and what I do at all. So why did I go through this long journey of calling myself a “data scientist”, trying to fit in in the “data science community” and now exiting?

It all started with a need to easily describe what I do.

To recall, my last proper full-time job was as a Quant at a leading investment bank, when I got this idea that rather than building obscure models for trading obscure corner cases, I might as well use use my model-building skills to solve “real problems” in other industries which were back then not as well served by quants.

So I started calling myself a “Quant consultant”, except that nobody really knew what “quant” meant. I got variously described as a “technologist” and a “statistician” and “data monkey” and what not, none of which really captured what I was actually doing – using data and building models to help companies improve their businesses.

And then “data science” happened. I forget where I first came across this term, but I had been primed for it by reading Hal Varian saying that the “sexiest job in the next ten years will be statisticians”. I must mention that I had never come across the original post by DJ Patil and Thomas Davenport (that introduces the term) until I looked for it for my newsletter last year.

All I saw was “data” and “science”. I used data in my work, and I tried to bring science into the way my clients thought. And by 2014, Data Science had started becoming a thing. And I decided to ride the wave.

Now, data science has always been what artificial intelligence pioneer Marvin Minsky called a “suitcase term” – words or phrases that mean different things to different people (I heard about the concept first from this brilliant article on the “seven deadly sins of AI predictions“).

For some people, as long as some data is involved, and you do something remotely scientific it is data science. For others, it is about the use of sophisticated methods on data in order to extract insights. Some others conflate data science with statistics. For some others, only “machine learning” (another suitcase term!) is data science. And in the job market, “data scientist” can sometimes be interpreted as “glorified Python programmer”.

And right from inception, there were the data science jokes, like this one:

It is pertinent to put a whole list of it here.

‘Data Scientist’ is a Data Analyst who lives in California”
“A data scientist is someone who is better at statistics than any software engineer and better at software engineering than any statistician.”
“A data scientist is a business analyst who lives in New York.”
“A data scientist is a statistician who lives in San Francisco.”
“Data Science is statistics on a Mac.”

I loved these jokes, and thought I had found this term that had rather accurately described me. Except that it didn’t.

The thing with suitcase terms is that they evolve over time, as they start getting used differentially in different contexts. And so it was with data science. Over time, it has been used in a dominant fashion by people who mean it in the “machine learning” sense of the term. In fact, in most circles, the defining features of data scientists is the ability to write code in python, and to use the scikit learn package – neither of which is my distinguishing feature.

While this dissociation with the phrase “data science” has been coming for a long time (especially after my disastrous experience in the London job market in 2017), the final triggers I guess were a series of posts I wrote on LinkedIn in August/September this year.

The good thing about writing is that it helps you clarify your mind, and as I ranted about what I think data science should be, I realised over time that what I have in mind as “data science” is very different from what the broad market has in mind as “data science”. As per the market definition, just doing science with data isn’t data science any more – instead it is defined rather narrowly as a part of the software engineering stack where problems are solved based on building machine learning models that take data as input.

So it is prudent that I stop using the phrase “data science” and “data scientist” to describe myself and the work that I do.

PS: My newsletter will continue to be called “the art of data science”. The name gets “grandfathered” along with other ongoing assignments where I use the term “data science”.

Programming Languages

I take this opportunity to apologise for my prior belief that all that matters is thinking algorithmically, and language in which the ideas are expressed doesn’t matter.

About a decade ago, I used to make fun of information technology company that hired developers based on the language they coded in. My contention was that writing code is a skill that you either have or you don’t, and what a potential employer needs to look for is the ability to think algorithmically, and then render ideas in code. 

While I’ve never worked as a software engineer I find myself writing more and more code over the years as a part of doing data analysis. The primary tool I use is R, where coding doesn’t really feel like coding, since it is a rather high level language. However, I’m occasionally asked to show code in Python, since some clients are more proficient in that, and the one thing that has done is to teach me the value of domain knowledge of a programming language. 

I take this opportunity to apologise for my prior belief that all that matters is thinking algorithmically, and language in which the ideas are expressed doesn’t matter. 

This is because the language you usually program in subtly nudges you towards thinking in a particular way. Having mostly used R over the last decade, I think in terms of tables and data frames, and after having learnt tidyverse earlier this year, my way of thinking algorithmically has become in a weird way “object oriented” (no, this has nothing to do with classes). I take an “object” (a data frame) and then manipulate it in various ways, changing it, summarising stuff, calculating things on the fly and aggregating, until the point where the result comes out in an elegant manner. 

And while Pandas allows chaining (in fact, it is from Pandas that I suspect the tidyverse guys got the idea for the “%>%” chaining operator), it is by no means as complete in its treatment of chaining as R, and that that makes things tricky. 

Moreover, being proficient in R makes you think in terms of vectorised operations, and when you see that python doesn’t necessarily offer that, and and operations that were once simple in R are now rather complicated in Python, using list comprehension and what not. 

Putting it another way, thinking algorithmically in the framework offered by one programming language makes it rather stressful to express these thoughts in another language where the way of algorithmic thinking is rather different. 

For example, I’ve never got the point of the index in pandas dataframes, and I only find myself “resetting” it constantly so that my way of addressing isn’t mangled. Compared to the intuitive syntax in R, which is first and foremost a data analysis tool, and where the data frame is “native”, the programming language approach of python with its locs and ilocs is again irritating. 

I can go on… 

And I’m guessing this feeling is mutual – someone used to doing things the python way would find R’s syntax and way of doing things rather irritating. R’s machine learning toolkit for example is nowhere as easy as scikit learn is in python (this doesn’t affect me since I seldom need to use machine learning. For example, I use regression less than 5% of the time in my work). 

The next time I see a job opening for a “java developer” I will not laugh like I used to ten years ago. I know that this posting is looking for a developer who can not only think algorithmically, but also algorithmically in the way that is most convenient to express in Java. And unlearning one way of algorithmic thinking and learning another isn’t particularly easy. 

The missing middle in data science

Over a year back, when I had just moved to London and was job-hunting, I was getting frustrated by the fact that potential employers didn’t recognise my combination of skills of wrangling data and analysing businesses. A few saw me purely as a business guy, and most saw me purely as a data guy, trying to slot me into machine learning roles I was thoroughly unsuited for.

Around this time, I happened to mention to my wife about this lack of fit, and she had then remarked that the reason companies either want pure business people or pure data people is that you can’t scale a business with people with a unique combination of skills. “There are possibly very few people with your combination of skills”, she had said, and hence companies had gotten around the problem by getting some very good business people and some very good data people, and hope that they can add value together.

More recently, I was talking to her about some of the problems that she was dealing with at work, and recognised one of them as being similar to what I had solved for a client a few years ago. I quickly took her through the fundamentals of K-means clustering, and showed her how to implement it in R (and in the process, taught her the basics of R). As it had with my client many years ago, clustering did its magic, and the results were literally there to see, the business problem solved. My wife, however, was unimpressed. “This requires too much analytical work on my part”, she said, adding that “If I have to do with this level of analytical work, I won’t have enough time to execute my managerial duties”.

This made me think about the (yet unanswered) question of who should be solving this kind of a problem – to take a business problem, recognise it can be solved using data, figuring out the right technique to apply to it, and then communicating the results in a way that the business can easily understand. And this was a one-time problem, not something you would need to solve repeatedly, and so without the requirement to set up a pipeline and data engineering and IT infrastructure around it.

I admit this is just one data point (my wife), but based on observations from elsewhere, managers are usually loathe to get their hands dirty with data, beyond perhaps doing some basic MS Excel work. Data science specialists, on the other hand, will find it hard to quickly get intuition for a one-time problem, get data in a “dirty” manner, and then apply the right technique to solving it, and communicate the results in a business-friendly manner. Moreover, data scientists are highly likely to be involved in regular repeatable activities, making it an organisational nightmare to “lease” them for such one-time efforts.

This is what I call as the “missing middle problem” in data science. Problems whose solutions will without doubt add value to the business, but which most businesses are unable to address because of a lack of adequate skillset in solving the issue; and whose one-time nature makes it difficult for businesses to dedicate permanent resources to solve.

I guess so far this post has all the makings of a sales pitch, so let me turn it into one – this is precisely the kind of problem that my company Bespoke Data Insights is geared to solving. We specialise in solving problems that lie at the cusp of business and data. We provide end-to-end quantitative solutions for typically one-time business problems.

We come in, understand your business needs, and use a hypothesis-driven approach to model the problem in data terms. We select methods that in our opinion are best suited for the precise problem, not hesitating to build our own models if necessary (hence the Bespoke in the name). And finally, we synthesise the analysis in the form of recommendations that any business person can easily digest and action on.

So – if you’re facing a business problem where you think data might help, but don’t know how to proceed; or if you are curious about all this talk about AI and ML and data science and all that, and want to include it in your business; or you want your business managers to figure out how to use the data  teams better, hire us.

Statistics and machine learning approaches

A couple of years back, I was part of a team that delivered a workshop in machine learning. Given my background, I had been asked to do a half-day session on Regression, and was told that the standard software package being used was the scikit-learn package in python.

Both the programming language and the package were new to me, so I dug around a few days before the workshop, trying to figure out regression. Despite my best efforts, I couldn’t locate how to find out the R^2. What some googling told me was surprising:

There exists no R type regression summary report in sklearn. The main reason is that sklearn is used for predictive modelling / machine learning and the evaluation criteria are based on performance on previously unseen data

As it happened, I requested the students at the workshop to install a package called statsmodels, which provides standard regression outputs. And then I proceeded to lecture to them on regression as I know it, including significance scores, p values, t statistics, multicollinearity and the likes. It was only much later was I to figure out that that is now how regression (and logistic regression) is done in the machine learning world.

In a statistical framework, the data sets in regression are typically “long” – you have a large number of data points, and a small number of variables. Putting it differently, we start off with a model with few degrees of freedom, and then “constrain” the variables with a large enough number of data points, so that if a signal exists, and it is in the right format (linear relationship and all that), we can pin it down effectively.

In a machine learning framework, it is common to run a regression where the number of data points is of the same order of magnitude as, or even smaller than the number of variables. Strictly speaking, such a problem is unbounded (there are too many degrees of freedom), and so regression is not well-defined. Instead, we rely upon “regularisation methods” to “tie down” the variables and (hopefully) produce a consistent solution.

Moreover, machine learning approaches are common to problems where individual predictor variables don’t have meaning. In this scenario, knowing whether a particular variable is significant or not is of no utility. Then, the signal in machine learning lies in the combination of variables, which means that multicollinearity (correlation between predictor variables) is not really a bad thing as it is in statistics. Variables not having meanings means that there are no correlations per se to be defined, and so machine learning models are harder to interpret, and are more likely to have hidden spurious correlations.

Also, when you have a small number of variables and a large number of data points, it is easy to get an “exact solution” for regression, which is what statistical methods use. In a machine learning framework with “wide” data, though, exact solutions are computationally infeasible, and so you need to use approximate algorithms such as gradient descent – which are common across ML techniques.

All in all, while statistics and machine learning might use techniques with the same name (“regression”, for example), they are both in theory and practice, very different ways to solve the problem. The important thing is to figure out the approach most suited for a particular problem, and use it accordingly.

Why data scientists should be comfortable with MS Excel

Most people who call themselves “data scientists” aren’t usually fond of MS Excel. It is slow and clunky, can only handle a million rows of data (and nearly crash your computer if you go anywhere close to that), and despite the best efforts of Visual Basic, is not very easy to program for doing repeatable tasks.

In fact, some data scientists may consider Excel to be “too downmarket” for them to use. At one firm I worked for, I had heard a rumour that using Excel for modelling was a fire-able offence, though I’m glad to report that I flouted this rule without much adverse effect. Yet, in my years as a “data science” and analytics consultant, and having done several modelling jobs before, I think Excel is an extremely necessary tool in a data scientist’s arsenal. There are several reasons for this.

The main one is communication. “Business types” love Excel – they use it for pretty much every official activity (I know of people who write documents in Excel). If you ask for a set of numbers, you are most likely to find it in an Excel sheet. I know of fairly large organisations which use Excel to store and transmit data (admittedly poor usage). And even non-quantitaive business types understand some of the basic quantitative functions thanks to Excel, such as joining (VLookup), pivoting, basic data cleaning (TRIM, VALUE, etc.), averaging, visualisation and sometimes even basic statistics such as correlation and regression.

One of the main problems that organisations face is lack of communication between data scientists and the business side (I mentioned this in a talk I gave last month: video here and slides here). Excel is an excellent middle ground, since it is reasonably quantitative and business people know how to use it.

In fact, in my consulting experience I’ve found that when working with clients, using Excel can make your client (usually a business person) feel more comfortable and involved in the analysis, speeding up the process and significantly improving collaboration. They’ll feel more empowered to intervene, which means they can add value, and they can feel especially happy if you occasionally let them enter some simple quantitative formulae.

The next advantage of Excel is that it puts the numbers out there. A long time back, when I was still doing full time jobs, I was asked to build a forecasting model (using a programming language) and couldn’t get it right for several months. And then on a whim I decided to use Excel, and when I saw the data in front of me, it was clear why the forecasts were so useless – because the data was so random.

Excel also allows you to quickly try things and iterate, again by putting the data and the analysis in front of you. Admittedly, the toolkit available is limited compared to what programming languages or statistical softwares can offer, but through clever usage (especially with Visual Basic), there is a lot you can achieve.

Then, Excel sometimes nudges you towards finding simple solutions. It is possible when you’re using a programming language to veer towards overly complicated solutions, and possibly use the proverbial nuclear weapon against the sparrow.

When I was working on the forecasting work a decade ago, I found that the forecasts would feed into a fairly complicated-looking model that had been developed over several years by several developers. On a whim, I decided to “do more” in Excel and managed to replicate the entire model in Excel (using VB and Solver). The people leading the product weren’t particularly happy, but using Excel was critical in ultimately moving to a simpler solution.

A similar thing occurred recently as well. I had been building a fairly complex optimisation model, which I tried replicating in Excel for communication purposes (so I could work on it together with the client). And it turned out there was a far simpler solution that I had missed all this time, and the simpler solution became apparent only because I used Excel.

I’m sure this is not an exhaustive list. So, if you’re a data scientist, you will do well to be at least conversant with Excel. I know it may only serve limited needs in terms of analysis, but the effort in learning  will get more than compensated for in the communication and collaboration and simplicity.

Tailpiece:
A long time ago, a co-worker passed by my desk and saw me work on Excel. He saw my spreadsheet and remarked, “oh, so many numbers! it must be very complicated” and went on his way. I don’t know if he is a data scientist now.

Yet another way of classifying data scientists

There are many axes along which we can classify data scientists.

We can classify based on the primary specialty, in terms “analytics”, “business intelligence” and “machine learning”. We can classify based on domain, into “financial data scientists” and “retail data scientists” and “industrial data scientists”. We can classify by the choice of primary software tool, into “R data scientists” and “Python data scientists” and “SAS data scientists”. We can also classify by expertise, such as “deep learning” and “statistics” and “stochastic calculus”. The axes are endless.

Here is my not-so-humble attempt to contribute yet another such axis based on my observations in the industry – “technology facing” and “business facing” data scientists.

Technology facing data scientists put the software first. You’ll see them building pipelines, making sure their solutions can be easily integrated into the software stack, and worrying about how quickly their analysis can run. They will spend a lot of time on data engineering and infrastructure works, and their first concern when designing a solution is that it should be easy to implement. They are highly process oriented and not so fond of hacks.

Business facing data scientists, on the other hand, are primarily concerned with insights, and don’t care much about technological niceties. The technological feasibility and ease of implementation of a solution is an afterthought. Their data is messy, and the process is not easily repeatable (might even involve some manual processes). But they make sure that the insights they draw can be easily understood by a human, and invest time and effort in communication and visualisation. They might even build tools to help the business side of the organisation understand what is happening in the model.

This distinction is actually unsurprising if you look at who the primary clients of these respective types are. The business facing data scientists are more likely to be employed in generating insights, and building models to try and understand what is happening. The technology-facing data scientists will have spent most of their careers building production systems, and are thus very well acquainted with the software engineering process.

It is important, however, to recognise this distinction, and employ the data scientists as per their specialisation. A technology-facing data scientist in a business-facing role might be seen as spending way too much effort in getting the technology right, and doing her own thing while being unmindful of the business clients. A business-facing data scientist in a technology facing role will end up producing messy solutions that may be insightful, but will be a nightmare to implement.

This was first posted on LinkedIn

Stirring the pile efficiently

Warning: This is a technical post, and involves some code, etc. 

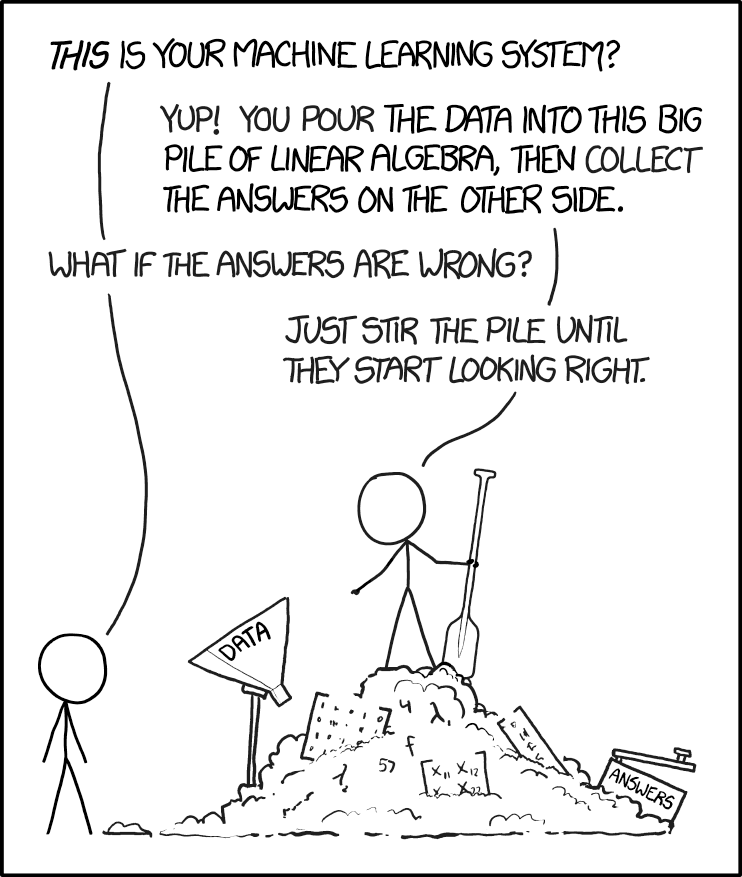
As I’ve ranted a fair bit on this blog over the last year, a lot of “machine learning” in the industry can be described as “stirring the pile”. Regular readers of this blog will be familiar with this image from XKCD by now:

Source: https://xkcd.com/1838/

Basically people simply take datasets and apply all the machine learning techniques they have heard of (implementation is damn easy – scikit learn allows you to implement just about any model in three similar looking lines of code; See my code here to see how similar the implementation is).

So I thought I’ll help these pile-stirrers by giving some hints of what method to use for different kinds of data. I’ve over-simplified stuff, and so assume that:

  1. There are two predictor variables X and Y. The predicted variable “Z” is binary.
  2. X and Y are each drawn from a standard normal distribution.
  3. The predicted variable Z is “clean” – there is a region in the X-Y plane where Z is always “true” and another region where Z is always “false”
  4. So the idea is to see which machine learning techniques are good at identifying which kind of geometrical figures.
  5. Everything is done “in-sample”. Given the nature of the data, it doesn’t matter if we do it in-sample or out-of-sample.

For those that understand Python (and every pile-stirrer worth his salt is excellent at Python), I’ve put my code in a nice Jupyter Notebook, which can be found here.

So this is what the output looks like. The top row shows the “true values” of Z. Then we have a row for each of the techniques we’ve used, which shows how well these techniques can identify the pattern given in the top row (click on the image for full size).

As you can see, I’ve chosen some common geometrical shapes and seen which methods are good at identifying those. A few pertinent observations:

  1. Logistic regression and linear SVM are broadly similar, and both are shit for this kind of dataset. Being linear models, they fail to deal with non-linear patterns
  2. SVM with RBF kernel is better, but it fails when there are multiple “true regions” in the dataset. At least it’s good at figuring out some non-linear patterns. However, it can’t figure out the triangle or square – it draws curves around them, instead.
  3. Naive Bayesian (I’ve never understood this even though I’m pretty good at Bayesian statistics, but I understand this is a commonly used technique; and I’ve used default parameters so not sure how it is “Bayesian” even) can identify some stuff but does badly when there are disjoint regions where Z is true.
  4. Ensemble methods such as Random Forests and Gradient Boosting do rather well on all the given inputs. They do well for both polygons and curves. Elsewhere, Ada Boost mostly does well but trips up on the hyperbola.
  5. For some reason, Lasso fails to give an output (in the true spirit of pile-stirring, I didn’t explore why). Ridge is again a regression method and so does badly on this non-linear dataset
  6. Neural Networks (Multi Layer Perceptron to be precise) does reasonably well, but can’t figure out the sharp edges of the polygons.
  7. Decision trees again do rather well. I’m pleasantly surprised that they pick up and classify the disjoint sets (multi-circle and hyperbola) correctly. Maybe it’s the way scikit learn implements them?

Of course, the datasets that one comes across in real life are never such simple geometrical figures, but I hope that this set can give you some idea on what techniques to use where.

At least I hope that this makes you think about the suitability of different techniques for the data rather than simply applying all the techniques you know and then picking the one that performs best on your given training and test data.

That would count as nothing different from p-hacking, and there’s an XKCD for that as well!

Source: https://xkcd.com/882/