Creative Cycles

When you’re doing creative work, your work broadly falls into two phases – the “invention phase” and the “implementation phase”. Both imply what they mean.

There are times when you are tinkering around and experimenting to find something fundamentally new that is cool. And then, once you have made the breakthrough in finding something cool, you need to make it useful. And this can take considerable amount of work, and its own creativity.

So if you are one person doing a “creative job”, your work will alternate in these cycles – where you create and you implement. The cycles are unlikely to be periodic. Some creative solutions are so creative that implementation is a breeze. In most cases, the inspiration is only 1% of the problem – the devil in the details for which you need to perspire.

When you are part of a creative team, this cycle thing can play out in different ways. Some teams form a caste system, where one set of people work purely on the invention phase, while the other works on the implementation phase. This is especially useful when solving highly complex problems, in which case the skills required for the invention and implementation phases are different.

The big cost of having separate teams like his is the cost of communication (AGES back, when GPUs were just becoming a thing, I was part of a committee that was exploring the use of GPUs in our work. One of the findings there was that GPUs can do the work incredibly fast, but the data transfer from GPUs to CPUs was slow, and could be a bottleneck. I assume that problem is solved now). People sometimes grossly underestimate the effort involved in communicating your solution to someone else. Even if you manage to communicate, there can be significant handholding that might be required to get the other team to take forward your invention.

And so this investment in communication cost is worth it if and only if the work is complex enough. Think of large industrial projects – such as the manufacture of the iPhone, for example – they are complex enough that you need several specialist teams to perform the entire creative process. And in the larger scheme of the complexity, the cost of communication across teams is small.

On the other hand, this usage of multiple teams to perform a creative process can be massive overkill for simpler work – there the cost of communication can far overpower the gains in efficiency through specialisation.

Anyway, I’m getting distracted here.

Coming back, the alternative is to have the same people or sub-teams perform the invention and implementation stages of the creative process. Here, I’ve seen things play out in multiple ways.

Some teams are uncorrelated – this means that different members or sub-teams are in different phases of the work. As a consequence, this kind of a team constantly provides creative output. When some of the people are deep in implementation, others are inventing. And the other way round. This means that the team is constantly both coming up with new ideas and delivering stuff.

Other teams can be more correlated – either everyone is working on the same thing, or the whole team moves in sync (invention at some points in time, implementation at others). Here the issue is that there can go long periods of time without the team really producing anything – in the common invention phase, no shit is getting done. In the common implementation phase, there are no new ideas.

This can lead to stagnation in the team, and frustration outside. And so not ideal.

The other related concept is in terms of management. Some managers of creative teams are better off at managing the invention phase. Others are better off at managing the implementation phase. Given that the creative process involves both, for the team to be effective, we need managers who can manage both as well.

And this is easier said than done in a single person, and so you need a management team. And what you find is that you have a “complementary number two” (no pun intended). If you as the team leader is better off at invention, you get a number two who is better at implementation. And the two (or more) of you together manage the process.

I’ve spoken about this before – this can sometimes lead to suboptimal succession. Let’s say the inventive head leaves. The organisation promotes the implementation number two. Now, it is contingent upon this new number one to get a (inventive) number two asap. If that doesn’t happen, invention can cease. The team will carry on for a while implementing the already invented stuff, and then grind to a halt.

Similarly if an implementation head leaves, the inventive number two gets promoted. And unless a new implementation number two is hired, you’ll see lots of proofs of concept and little actual implementation. Again suboptimal.

Code Density

As many of the regular readers of this blog know, I largely use R for most of my data work. There have been a few occasions when I’ve tried to use Python, but have found that I’m far less efficient in that than I am with R, and so abandoned it, despite the relative ease of putting things into production.

Now in my company, like in most companies, people use both Python and R (the team that reports to me largely uses R, everyone else largely uses Python). And while till recently I used to claim that I’m multilingual in the sense that I can read Python code fairly competently, of late I’m not sure I am. I find it increasingly difficult to parse and read production grade python code.

And now, after some experiments with ChatGPT, and exploring other people’s codes, I have an idea on why I’m finding it hard to read production-grade Python code. It has to do with “code density”.

Of late I’ve been experimenting with Spark (finally, in this job I do a lot of “big data” work – something I never had to in my consulting career prior to this). Related to this, I was reading someone’s PySpark code.

And then it hit me – the problem (rather, my problem) with Python is that it is far more verbose than R. The number of characters or lines of code required to do something in Python is far more than what you need in R (especially if you are using the tidyverse family of packages, which I do, including sparklyr for spark).

Why does the density of code matter? It is to do with aesthetics and modularity and ease of understanding.

Yesterday I was writing some code that I plan to put into production. After a few hours of coding, I looked at the code and felt disgusted with myself – it was a way too long monolithic block of code. It might have been good when I was writing it, but I knew that if I were to revisit it in a week or two, I wouldn’t be able to understand what the hell was happening there.

I’ve never worked as a professional software engineer, but with the amount of coding I’ve done, I’ve worked out what is a “reasonable length for a code block”. It’s like that apocryphal story of Indian public examiners for high school exams who evaluate history answers based on how long they are – “if they were to place an ordinary Reynolds 045 pen vertically on the sheet, the answer should be longer than that for the student to get five marks”.

An answer in a high school history exam needs to be longer than this. A code block or function should be shorter than this

It’s the reverse here. Approximately speaking, if you were to place a Reynolds pen vertically on screen (at your normal font size), no function (or code block) can be longer than the pen.

This easily approximates how much the eye can see on one normal Macbook screen (I use a massive external monitor at work, and a less massive, but equally wide, one at home). If you have to keep scrolling up and down to understand the full logic, there is a higher chance you might make mistakes, and higher difficulty for someone to understand the code.

Till recently (as in earlier this week) I would crib like crazy that people coding in Python would make their code “too modular”. That I would have to keep switching back and forth between different functions (and classes!!) to make sense of some logic, and about how that would make codes hard to debug (I still think there is a limit to how modular you can make your ETL code).

Now, however (I’m writing this on a Saturday – I’m not working today), from the code density perspective, it all makes sense to me.

The advantage of R is that because the code is far denser, you can pack in a far greater amount of logic in a Reynolds pen length of code. So over the years I’ve gotten used to having this much logic being presented to me in one chunk (without having to scroll or switch functions).

The relatively lower density of Python, however, means that the same amount of logic that would be one function in R is now split across several different functions. It is not that the writer of the code is “making this too modular” or “writing functions just for the heck of it”. It is just that their “mental Reynolds pens” doesn’t allow them to pack in more lines in a chunk or function, and Python’s density means there is only so much logic that can go in there.

As part of my undergrad, I did a course on Software Engineering (and the one thing the professor told us then was that we should NOT take up software engineering as a career – “it’s a boring job”, he had said). In that, one of the things we learnt was that in conventional software services contexts, billing would happen as a (nonlinear) function of “kilo lines of code” (this was in early 2003).

Now, looking back, one thing I can say is that the rate per kilo line of R code ought to be much higher than the rate per kilo line of Python code.

Cross posted on my now-largely-dormant Art of Data Science newsletter

The Second Great Wall (of programming)

Back in 2000, I entered the Computer Science undergrad program at IIT Madras thinking I was a fairly competent coder. In my high school, I had a pretty good reputation in terms of my programming skills and had built a whole bunch of games.

By the time half the course was done I had completely fallen out of love with programming, deciding a career in Computer Science was not for me. I even ignored Kama (current diro)’s advice and went on to do an MBA.

What had happened? Basically it was a sudden increase in the steepness of the learning curve. Or that I’m a massive sucker for user experience, which the Computer Science program didn’t care for.

Back in school, my IDE of choice (rather the only one available) was TurboC, a DOS-based program. You would write your code, and then hit Ctrl+F9 to run the program. And it would just run. I didn’t have to deal with any technical issues. Looking back, we had built some fairly complex programs just using TurboC.

And then I went to IIT and found that there was no TurboC, no DOS. Most computers there had an ancient version of Unix (or worse, Solaris). These didn’t come with nice IDEs such as TurboC. Instead, you had to use vi (some of the computers were so old they didn’t even have vim) to write the code, and then compile it from outside.

Difficulties in coming to terms with vi meant that my speed of typing dropped. I couldn’t “code at the speed of thought” any more. This was the first give up moment.

Then, I discovered that C++ had now got this new set of “standard template libraries” (STL) with vectors and stuff. This was very alien to the way I had learnt C++ in school. Also I found that some of my classmates were very proficient with this, and I just couldn’t keep up with this. The effort seemed too much (and the general workload of the program was so high that I couldn’t get much time for “learning by myself”), so I gave up once  again.

Next, I figured that a lot of my professors were suckers for graphic UIs (though they denied us good UX by denying us good computers). This, circa 2001-2, meant programming in Java and writing applets. It was a massive degree of complexity (and “boringness”) compared to the crisp C/C++ code I was used to writing. I gave up yet again.

I wasn’t done with giving up yet. Beyond all of this, there was “systems programming”. You had to write some network layers and stuff. You had to go deep into the workings of the computer system to get your code to run. This came rather intuitively to most of my engineering-minded classmates. It didn’t to me (programming in C was the “deepest” I could grok). And I gave up even more.

A decade after I graduated from IIT Madras, I visited IIM Calcutta to deliver a lecture. And got educated.

I did my B.Tech. project in “theoretical computer science”, managed to graduate and went on to do an MBA. Just before my MBA, I was helping my father with some work, and he figured I sucked at Excel. “What is the use of completing a B.Tech. in computer science if you can’t even do simple Excel stuff?”, he thundered.

In IIMB, all of us bought computers with pirated Windows and Office. I started using Excel. It was an absolute joy. It was a decade before I started using Apple products, but the UX of Windows was such a massive upgrade compared to what I’d seen in my more technical life.

In my first job (where I didn’t last long) I learnt the absolute joy of Visual Basic macros for Excel. This was another level of unlock. I did some insane gymnastics in that. I pissed off a lot of people in my second job by replicating what they thought was a complex model on an Excel sheet. In my third job, I replaced a guy on my team with an Excel macro. My programming mojo was back.

Goldman Sachs’s SLANG was even better. By the time I left from there, I had learnt R as well. And then I became a “data scientist”. People asked me to use Python. I struggled with it. After the user experience of R, this was too complex. This brought back bad memories of all the systems programming and dealing with bad UX I had encountered in my undergrad. This time I was in control (I was a freelancer) so I didn’t need to give up – I was able to get all my work done in R.

The second giving up

I’ve happily used R for most of my data work in the last decade. Recently at work I started using Databricks (still write my code in R there, using sparklyr), and I’m quite liking that as well. However, in the last 3-4 months there has been a lot of developments in “AI”, which I’ve wanted to explore.

The unfortunate thing is that most of this is available only in Python. And the bad UX problem is back again.

Initially I got excited, and managed to install Stable Diffusion on my personal Mac. I started writing some OpenAI code as well (largely using R). I started tracking developments in artificial intelligence, and trying some of them out.

And now, in the last 2-3 weeks, I’ve been struggling with “virtual environments”. Each newfangled open-source AI that is released comes with its own codebase and package requirements. They are all mutually incompatible. You install one package, and you break another package.

The “solution” to this, from what I could gather, is to use virtual environments – basically a sandbox for each of these things that I’ve downloaded. That, I find, is grossly inadequate. One of the points of using open source software is to experiment with connecting up two or more of them. And if each needs to be in its own sandbox, how is one supposed to do this? And how are all other data scientists and software engineers okay with this?

This whole virtual environment mess means that I’m giving up on programming once again. I won’t fully give up – I’ll continue to use R for most of my data work (including my job), but I’m on the verge of giving up in terms of these “complex AI”.

It’s the UX thing all over again. I simply can’t handle bad UX. Maybe it’s my ADHD. But when something is hard to use, I simply don’t want to use it.

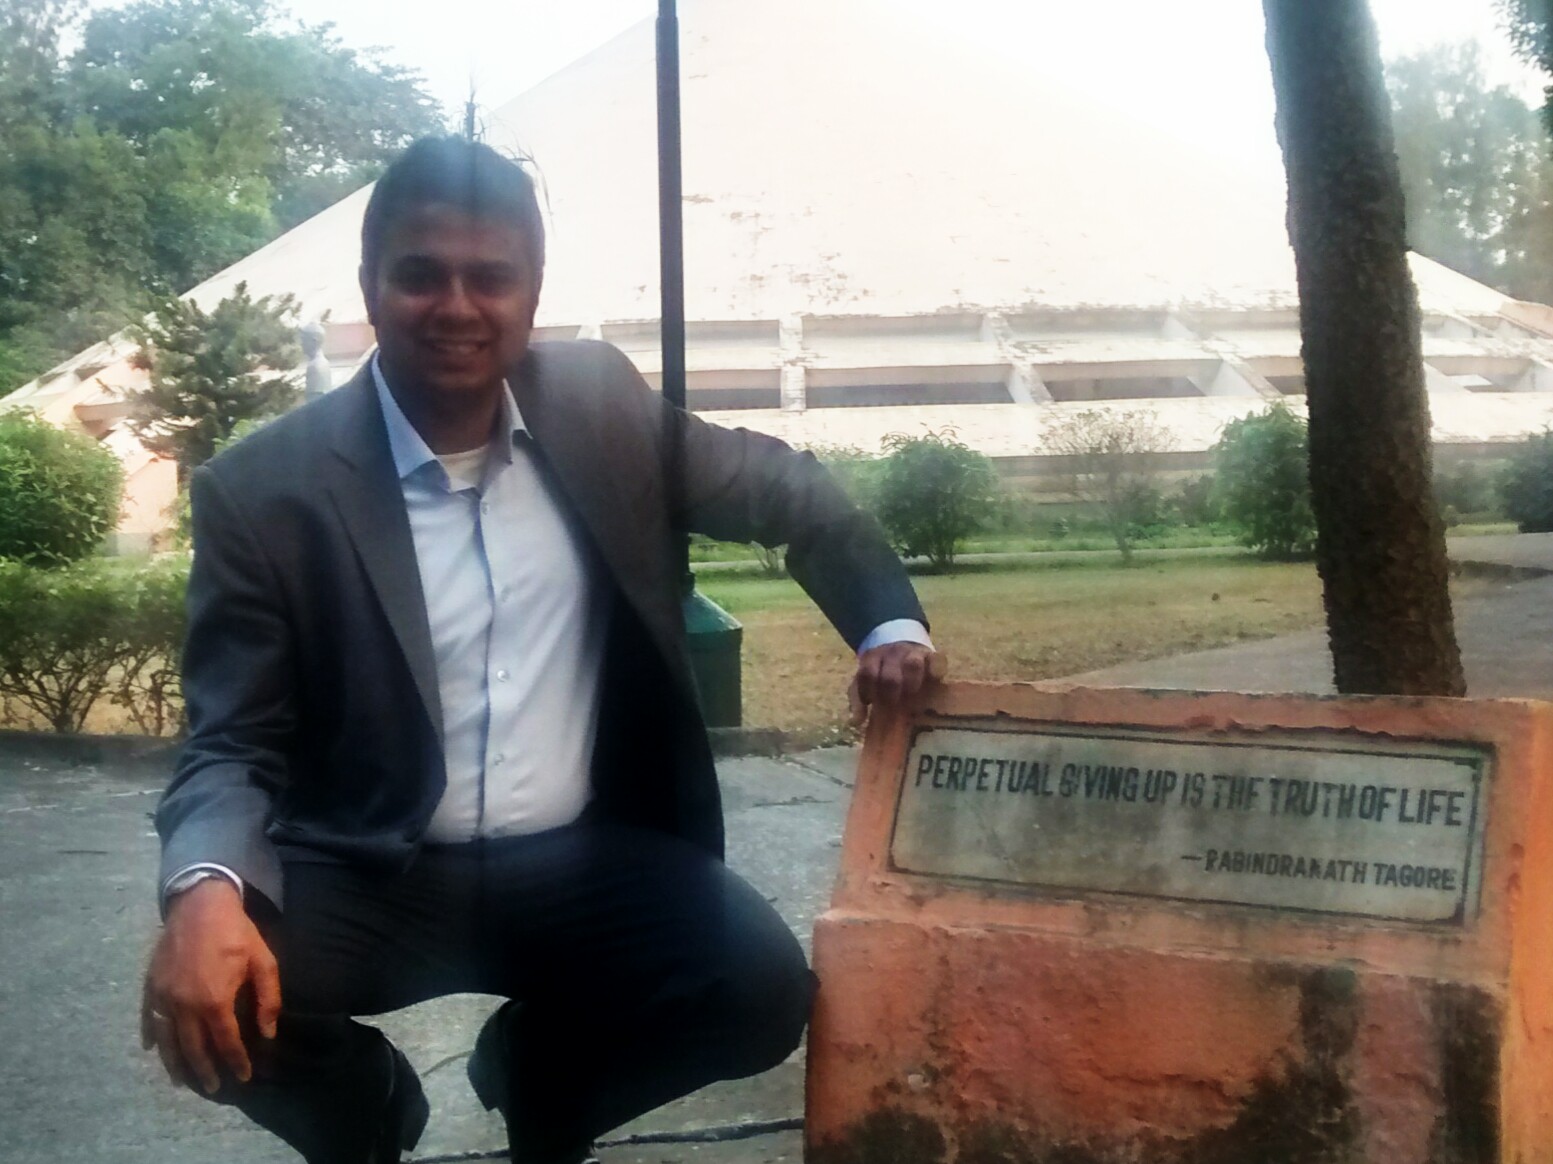
And so I’m giving up once again. Tagore was right.

Muggoos and overfitting

Back when I was a student, there was this (rather large) species of students who we used to call “muggoos”. They were called that because they would have a habit of “mugging up the answers” – basically they would learn verbatim stuff in the textbooks and other reading material, and then just spit it out during the exams.

They were incredibly hardworking, of course – since the volume of stuff to mug was immense – and they would make up for their general lack of understanding of the concepts with their massive memories and rote learning.

On average, they did rather well – with all that mugging, the downside was floored. However, they would stumble badly in case of any “open book exams” (where we would be allowed to carry textbooks into the exams) – since the value of mugging there was severely limited. I remember having an argument once with some topper-type muggoos (with generally much better grades than me ) on whether to keep exams in a particular course open book or closed book. They all wanted closed book of course.

This morning, I happened to remember this species while chatting with a friend. He was sending me some screenshots from ChatGPT and was marvelling at something which it supposedly made up (I remembered it as a popular meme from 4-5 years back). I immediately responded that ChatGPT was simply “overfitting” in this case.

Since this was a rather popular online meme, and a lot of tweets would have been part of ChatGPT’s training data, coming up with this “meme-y joke” was basically the algorithm remembering this exact pattern that occurred multiple times in the training set. There was no need to intuit or interpolate or hallucinate – the number of occurrences in the training set meant this was an “obvious joke”.

In that sense, muggoos are like badly trained pieces of artificial intelligence (well, I might argue that their intelligence IS artificial) – they haven’t learnt the concepts, so they are unable to be creative or hallucinate. However, they have been “trained” very very well on the stuff that is there in the textbooks (and other reading material) – and the moment they see part of that it’s easy for them to “complete the sentences”. So when questions in the exams come straight out of the reading materials (as they do in a LOT of indian universities and school boards) they find it easy to answer.

However, when tested on “concepts”, they now need to intuit – and infer based on their understanding. In that sense, they are like badly trained machine learning models.

One of the biggest pitfalls in machine learning is “overfitting” – where you build a model that is so optimised to the training data that it learns quirks of the data that you don’t want it to learn. It performs superbly on the training dataset. Now, when faced with an unknown (“out of syllabus”) test set, it underperforms like crazy. In machine learning, we use techniques such as cross validation to make sure algorithms don’t overfit.

That, however, is not how the conventional Indian education system trains you – throughout most of the education, you find that the “test set” is a subset of the “training set” (questions in examinations come straight out of the textbook). Consequently, people with the ability to mug find that it is a winning strategy to just “overfit” and learn the textbooks verbatim – the likelihood of being caught out by unseen test data is minimal.

And then IF they get out into the real world, they find that a lot of the “test data” is unknown, and having not learnt to truly learn from the data, they struggle.

PS: Overfitting is not the only way machine learning systems misbehave. Sometimes they end up learning the entirely wrong pattern!

Stable Diffusion and Chat GPT and Logistic Regression

For a long time I have had this shibboleth on whether someone is a “statistics person or a machine learning person”. It is based on what they call regressions where the dependent variable is binary. Statisticians simply call it “logit” (there is also a “probit“).

Now, in terms of implementation as well, there is one big difference between the way “logit” is modelled versus “logistic regression”. For a logit model (if you are using python, you need to use the “statsmodels” package for this, not scikit learn), the number of observations needs to far exceed the number of independent variables.

Else, a matrix that needs to be inverted as part of the solution will turn out to be singular, and there will be no solution. I guess I betrayed my greater background in statistics than in Machine Learning when, in 2018, I wrote this blogpost on machine learning being a “process to tie down coefficients in maths models“.

For “logistic regression” (as opposed to “logit”) puts no such constraint – on the regression matrix being invertible. Instead of actually inverting the matrix, machine learning approaches simply focus on learning the terms of the inverted matrix using gradient descent (basically the opposite of hill climbing), so mathematical inconveniences such as matrices that cannot be inverted are moot there.

And so you have logistic regression models with thousands of variables, often calibrated with a fewer number of data points. To be honest, I can’t understand this fully – without sufficient information (data points) to calibrate the coefficients, there will always be a sense of randomness in the output. The model has too many degrees of freedom, and so there is additional information the model is supplying (apart from what was supplied in the training data!).

Of late I have been playing a fair bit with generative AI (primarily ChatGPT and Stable Diffusion). The other day, my daughter and I were alone in my in-laws’ house, and I told her “look I’ve brought my personal laptop along, if you want we can play with it”. And she had demanded that she “play with stable diffusion”. This is the image she got for “tiger chasing deer”.

I have written earlier here about how the likes of ChatGPT and Stable Diffusion in a way redefine “information content“.


And if you think about it, almost by definition, “generative AI” creates information (and hallucinates, like in the above pic). Traditionally speaking, a “picture is worth a thousand words”, but if you can generate a picture with just a few words of prompt, the information content in it is far less than a thousand words.

In some sense, this reminds me of “logistic regression” once again. By definition (because it is generative), there is insufficient “tying down of coefficients”, because of which the AI inevitably ends up “adding value of its own”, which by definition is random.

So, you will end up getting arbitrary results. ChatGPT often gives you wrong answers to questions. Dall-E and Midjourney and Stable Diffusion will return nonsense images such as the above. Because a “generative AI” needs to create information, by definition, all the coefficients of the model cannot be well calibrated. 

And the consequence of this is that however good these AIs get, however much data is used to train them, there will always be an element of randomness to them. There will always be test cases where they give funny results.

No, AGI is not here yet.

Chat GPT and Information Content

For the last week or so I’ve been fooling around with Chat GPT. It’s been a lot of fun, if you can endure the verbosity of its answers. Yesterday, at work, I used it for tech support when some people I was talking to were using too much jargon.

Before I came home from work yesterday, my last conversation was with a couple of recruiters, about a role that I’m hiring for. So when I got home, on a whim, I wondered if I could check out of Chat GPT could write job descriptions for me.

I asked:

write a job description for a senior data scientist at India’s largest logistics company. 4-7 years exp. Needs to have experience in ML, OR and statistics, and be able to work close to business and on ambiguous problems

It answered (pasting in full since the screenshot above is limited):

Job Title: Senior Data Scientist

Company: India’s Largest Logistics Company

Location: India

Experience: 4-7 years

We are seeking an experienced and highly skilled Senior Data Scientist to join our team at India’s largest logistics company. In this role, you will be responsible for using machine learning, operations research, and statistics to drive business insights and decision making.

As a Senior Data Scientist, you will have a deep understanding of data science techniques and technologies, and will be able to apply them to complex and ambiguous problems. You will be able to work closely with business teams to understand their needs and to develop solutions that drive value for the company.

To be successful in this role, you should have at least 4-7 years of experience in data science, and should have a strong background in machine learning, operations research, and statistics. You should be able to work independently and be comfortable working on complex and ambiguous problems.

Responsibilities:

  • Use machine learning, operations research, and statistics to drive business insights and decision making
  • Work closely with business teams to understand their needs and develop solutions
  • Develop and maintain data pipelines and systems
  • Collaborate with other data scientists and cross-functional teams to develop and implement solutions

Qualifications:

  • Bachelor’s or Master’s degree in a quantitative field, such as computer science, statistics, or engineering
  • At least 4-7 years of experience in data science
  • Strong background in machine learning, operations research, and statistics
  • Ability to work independently and on complex and ambiguous problems
  • Excellent communication and collaboration skills
  • Experience with Python, R, or other programming languages is a plus

We offer a competitive salary and benefits package, as well as opportunities for growth and advancement. If you are an experienced data scientist with a passion for driving business insights and decision making, we encourage you to apply.

In the past when I’ve been hiring, I’ve been a bit annoyed by people asking for job descriptions. I’ve largely found them to be fluff and boilerplate, and I’ve tried to get away with a sentence or two. However, due to the insistence of recruiters and candidates alike, I’ve ended up writing elaborate job descriptions. I don’t need to any more.

This post, however, is not about hiring (but yeah – I am hiring, and the above job description is reasonably accurate). It’s about information content in general.

Traditionally, information content has been measured in bits. A bit is the amount of information contained in an equi-probable binary event.

Sometimes when we find that someone is too verbose and using too many words when fewer would suffice, we say that their bit rate is low. We also use “low bit rate” to describe people such as former Prime Minister Atal Behari Vajpayee, who would speak incredibly slowly.

However, beyond the bit, which is a fairly technical concept, it has been difficult to quantify information content. Sometimes you read an article or a story and find that there is nothing much to it. But given the natural language, and the context of various words, it is impossible to quantify the information content.

Now, with Chat GPT, maybe it becomes a bit easier (though one would need a “reverse chat GPT algo”, to find the set of prompts required for Chat GPT to churn out a particular essay). Above, for example, I’ve shown how much fluff there generally is to the average job description – a fairly short prompt generated this longish description that is fairly accurate.

So you can define the information content of a piece or essay in terms of the number of words in the minimum set of prompts required for Chat GPT (or something like it) to come up with it. If you are a boring stereotypical writer, the set of prompts required will be lower. If you are highly idiosyncratic, then you will need to give a larger number of prompts for Chat GPT to write like you. You know where I’m going.

This evening, in office, a colleague commented that now it will be rather easy to generate marketing material. “Even blogs might become dead, since with a few prompts you can get that content”, he said (it can be a legit service to build off the Chat GPT API to take a tweet and convert it into an essay).

I didn’t tell him then but I have decided to take it up as a challenge. I consider myself to be a fairly idiosyncratic writer, which means I THINK there is a fair bit of information content in what I write, and so this blog will stay relevant. Let’s see how it goes.

PS: I still want to train a GAN on my blog (well over a million words, at last count) and see how it goes. If you know of any tools I can use for this, let me know!


A day at an award function

So I got an award today. It is called “exemplary data scientist”, and was given out by the Analytics India Magazine as part of their MachineCon 2022. I didn’t really do anything to get the award, apart from existing in my current job.

I guess having been out of the corporate world for nearly a decade, I had so far completely missed out on the awards and conferences circuit. I would see old classmates and colleagues put pictures on LinkedIn collecting awards. I wouldn’t know what to make of it when my oldest friend would tell me that whenever he heard “eye of the tiger”, he would mentally prepare to get up and go receive an award (he got so many I think). It was a world alien to me.

Parallelly, I used to crib about how while I’m well networked in India, and especially in Bangalore, my networking within the analytics and data science community is shit. In a way, I was longing for physical events to remedy this, and would lament that the pandemic had killed those.

So I was positively surprised when about a month ago Analytics India Magazine wrote to me saying they wanted to give me this award, and it would be part of this in-person conference. I knew of the magazine, so after asking around a bit on legitimacy of such awards and looking at who had got it the last time round, I happily accepted.

Most of the awardees were people like me – heads of analytics or data science at some company in India. And my hypothesis that my networking in the industry was shit was confirmed when I looked at the list of attendees – of 100 odd people listed on the MachineCon website, I barely knew 5 (of which 2 didn’t turn up at the event today).

Again I might sound like a n00b, but conferences like today are classic two sided markets (read this eminently readable paper on two sided markets and pricing of the same by Jean Tirole of the University of Toulouse). On the one hand are awardees – people like me and 99 others, who are incentivised to attend the event with the carrot of the award. On the other hand are people who want to meet us, who will then pay to attend the event (or sponsor it; the entry fee for paid tickets to the event was a hefty $399).

It is like “ladies’ night” that pubs have, where on a particular days of the week, women who go to the pub get a free drink. This attracts women, which in turn attracts men who seek to court the women. And what the pub spends in subsidising the women it makes back in terms of greater revenue from the men on the night.

And so it was at today’s conference. I got courted by at least 10 people, trying to sell me cloud services, “AI services on the cloud”, business intelligence tools, “AI powered business intelligence tools”, recruitment services and the like. Before the conference, I had received LinkedIn requests from a few people seeking to sell me stuff at the conference. In the middle of the conference, I got a call from an organiser asking me to step out of the hall so that a sponsor could sell to me.

I held a poker face with stock replies like “I’m not the person who makes this purchasing decision” or “I prefer open source tools” or “we’re building this in house”.

With full benefit of hindsight, Radisson Blu in Marathahalli is a pretty good conference venue. An entire wing of the ground floor of the hotel is dedicated for events, and the AIM guys had taken over the place. While I had not attended any such event earlier, it had all the markings of a well-funded and well-organised event.

As I entered the conference hall, the first thing that struck me was the number of people in suits. Most people were in suits (though few wore ties; And as if the conference expected people to turn up in suits, the goodie bag included a tie, a pair of cufflinks and a pocket square). And I’m just not used to that. Half the days I go to office in shorts. When I feel like wearing something more formal, I wear polo T-shirts with chinos.

My colleagues who went to the NSE last month to ring the bell to take us public all turned up company T-shirts and jeans. And that’s precisely what I wore to the conference today, though I had recently procured a “formal uniform” (polo T-shirt with company logo, rather than my “usual uniform” which is a round neck T-shirt). I was pretty much the only person there in “uniform”. Towards the end of the day, I saw one other guy in his company shirt, but he was wearing a blazer over it!

Pretty soon I met an old acquaintance (who I hadn’t known would be at the conference). He introduced me to a friend, and we went for coffee. I was eating a cookie with the coffee, and had an insight – at conferences, you should eat with your left hand. That way, you don’t touch the food with the same hand you use to touch other people’s hands (surprisingly I couldn’t find sanitiser dispensers at the venue).

The talks, as expected, were nothing much to write about. Most were by sponsors selling their wares. The one talk that wasn’t by a sponsor was delivered by a guy who was introduced as “his greatgrandfather did this. His grandfather did that. And now this guy is here to talk about ethics of AI”. Full Challenge Gopalakrishna feels happened (though, unfortunately, the Kannada fellows I’d hung out with earlier that day hadn’t watched the movie).

I was telling some people over lunch (which was pretty good) that talking about ethics in AI at a conference has become like worshipping Ganesha as part of any elaborate pooja. It has become the de riguer thing to do. And so you pay obeisance to the concept and move on.

The awards function had three sections. The first section was for “users of AI” (from what I understood). The second (where I was included) was for “exemplary data scientists”. I don’t know what the third was for (my wife is ill today so I came home early as soon as I’d collected my award), except that it would be given by fast bowler and match referee Javagal Srinath. Most of the people I’d hung out with through the day were in the Srinath section of the awards.

Overall it felt good. The drive to Marathahalli took only 45 minutes each way (I drove). A lot of people had travelled from other cities in India to reach the venue. I met a few new people. My networking in data science and analytics is still not great, but far better than it used to be. I hope to go for more such events (though we need to figure out how to do these events without that talks).

PS: Everyone who got the award in my section was made to line up for a group photo. As we posed with our awards, an organiser said “make sure all of you hold the prizes in a way that the Intel (today’s chief sponsor) logo faces the camera”. “I guess they want Intel outside”, I joked. It seemed to be well received by the people standing around me. I didn’t talk to any of them after that, though.

The “intel outside” pic. Courtesy: https://www.linkedin.com/company/analytics-india-magazine/posts/?feedView=all


Structures of professions and returns to experience

I’ve written here a few times about the concept of “returns to experience“. Basically, in some fields such as finance, the “returns to experience” is rather high. Irrespective of what you have studied or where, how long you have continuously been in the industry and what you have been doing has a bigger impact on your performance than your way of thinking or education.

In other domains, returns to experience is far less. After a few years in the profession, you would have learnt all you had to, and working longer in the job will not necessarily make you better at it. And so you see that the average 15 years experience people are not that much better than the average 10 years experience people, and so you see salaries stagnating as careers progress.

While I have spoken about returns to experience, till date, I hadn’t bothered to figure out why returns to experience is a thing in some, and only some, professions. And then I came across this tweetstorm that seeks to explain it.

Now, normally I have a policy of not reading tweetstorms longer than six tweets, but here it was well worth it.

It draws upon a concept called “cognitive flexibility theory”.

Basically, there are two kinds of professions – well-structured and ill-structured. To quickly summarise the tweetstorm, well-structured professions have the same problems again and again, and there are clear patterns. And in these professions, first principles are good to reason out most things, and solve most problems. And so the way you learn it is by learning concepts and theories and solving a few problems.

In ill-structured domains (eg. business or medicine), the concepts are largely the same but the way the concepts manifest in different cases are vastly different. As a consequence, just knowing the theories or fundamentals is not sufficient in being able to understand most cases, each of which is idiosyncratic.

Instead, study in these professions comes from “studying cases”. Business and medicine schools are classic examples of this. The idea with solving lots of cases is NOT that you can see the same patterns in a new case that you see, but that having seen lots of cases, you might be able to reason HOW to approach a new case that comes your way (and the way you approach it is very likely novel).

Picking up from the tweetstorm once again:


It is not hard to see that when the problems are ill-structured or “wicked”, the more the cases you have seen in your life, the better placed you are to attack the problem. Naturally, assuming you continue to learn from each incremental case you see, the returns to experience in such professions is high.

In securities trading, for example, the market takes very many forms, and irrespective of what chartists will tell you, patterns seldom repeat. The concepts are the same, however. Hence, you treat each new trade as a “case” and try to learn from it. So returns to experience are high. And so when I tried to reenter the industry after 5 years away, I found it incredibly hard.

Chess, on the other hand, is well-structured. Yes, alpha zero might come and go, but a lot of the general principles simply remain.

Having read this tweetstorm, gobbled a large glass of wine and written this blogpost (so far), I’ve been thinking about my own profession – data science. My sense is that data science is an ill-structured profession where most practitioners pretend it is well-structured. And this is possibly because a significant proportion of practitioners come from academia.

I keep telling people about my first brush with what can now be called data science – I was asked to build a model to forecast demand for air cargo (2006-7). The said demand being both intermittent (one order every few days for a particular flight) and lumpy (a single order could fill up a flight, for example), it was an incredibly wicked problem.

Having had a rather unique career path in this “industry” I have, over the years, been exposed to a large number of unique “cases”. In 2012, I’d set about trying to identify patterns so that I could “productise” some of my work, but the ill-structured nature of problems I was taking up meant this simply wasn’t forthcoming. And I realise (after having read the above-linked tweetstorm) that I continue to learn from cases, and that I’m a much better data scientist than I was a year back, and much much better than I was two years back.

On the other hand, because data science attracts a lot of people from pure science and engineering (classically well-structured fields), you see a lot of people trying to apply overly academic or textbook approaches to problems that they see. As they try to divine problem patterns that don’t really exist, they fail to recognise novel “cases”. And so they don’t really learn from their experience.

Maybe this is why I keep saying that “in data science, years of experience and competence are not correlated”. However, fundamentally, that ought NOT to be the case.

This is also perhaps why a lot of data scientists, irrespective of their years of experience, continue to remain “junior” in their thinking.

PS: The last few paragraphs apply equally well to quantitative finance and economics as well. They are ill-structured professions that some practitioners (thanks to well-structured backgrounds) assume are well-structured.

Modelling for accuracy

Recently I’ve been remembering the first assignment of my “quantitative methods 2” course at IIMB back in 2004. In the first part of that course, we were learning regression. And so this assignment involved a regression problem. Not too hard at first sight – maybe 3 explanatory variables.

We had been randomly divided into teams of four. I remember working on it in the Computer Centre, in close proximity to some other teams. I remember trying to “do gymnastics” – combining variables, transforming them, all in the hope of trying to get the “best possible R square”. From what I remember, most of the groups went “R square hunting” that day. The assignment had been cleverly chosen such that for an academic exercise, the R Square wasn’t very high.

As an aside – one thing a lot of people take a long time to come to terms with is that in “real life” (industry problems) R squares aren’t usually that high. Forecast accuracy isn’t that high. And that the elegant methods they had learnt back in school / academia may not be as elegant any more in industry. I think I’ve written about this, but I can’t find the link now.

Anyway, back to QM2. I remember the professor telling us that three groups would be chosen at random on the day of the assignment submission, and from each of these three groups one person would be chosen at random who would have to present the group’s solution to the class. I remember that the other three people in my group all decided to bunk class that day! In any case, our group wasn’t called to present.

The whole point of this massive build up is – our approach (and the approach of most other groups) had been all wrong. We had just gone in a mad hunt for R square, not bothering to figure out whether the wild transformations and combinations that we were making made any business sense. Moreover, in our mad hunt for R square, we had all forgotten to consider whether a particular variable was significant, and if the regression itself was significant.

What we learnt was that while R square matters, it is not everything. The “model needs to be good”. The variables need to make sense. In statistics you can’t just go about optimising for one metric – there are several others. And this lesson has stuck with me. And guides how I approach all kinds of data modelling work. And I realise that is in conflict with the way data science is widely practiced nowadays.

The way data science is largely practiced in the wild nowadays is precisely a mad hunt for R Square (or area under ROC curve, if you’re doing a classification problem). Whether the variables used make sense doesn’t matter. Whether the transformations are sound doesn’t matter. It doesn’t matter at all whether the model is “good”, or appropriate – the only measure of goodness of the model seems to be the R square!

In a way, contests such as Kaggle have exacerbated this trend. In contests, typically, there is a precise metric (such as R Square) that you are supposed to maximise. With contests being evaluated algorithmically, it is difficult to evaluate on multiple parameters – especially not whether “the model is good”. And since nowadays a lot of data scientists hone their skills by participating in contests such as on Kaggle, they are tuned to simply go R square hunting.

Also, the big difference between Kaggle and real life is that in Kaggle, the model that you build doesn’t matter. It’s just a combination. You get the best R square. You win. You take the prize. You go home.

You don’t need to worry about how the data for the model was collected. The model doesn’t have to be implemented. No business decisions need to be made based on the model. Contest done, model done.

Obviously that is not how things work in real life. Building the model is only one in a long series of steps in solving the business problem. And when you focus too much on just one thing – the model’s accuracy in the data that you have been given, a lot can be lost in the rest of the chain (including application of the model in future situations).

And in this way, by focussing on just a small portion of the entire data science process (model building), I think Kaggle (and other similar competition platforms) has actually done a massive disservice to data science itself.

Tailpiece

This is completely unrelated to the rest of the post, but too small to merit a post of its own.

Suppose you ask a software engineer to sort a few datasets. He goes about applying bubble sort, heap sort, quick sort, insertion sort and a whole host of other techniques. And then picks the one that sorted the given datasets fastest.

That’s precisely how it seems “data science” is practiced nowadays

Junior Data Scientists

Since this is a work related post, I need to emphasise that all opinions in this are my own, and don’t reflect that of any organisation / organisations I might be affiliated with

The last-released episode of my Data Chatter podcast is with Abdul Majed Raja, a data scientist at Atlassian. We mostly spoke about R and Python, the two programming languages / packages most used for data science, and spoke about their relative merits and demerits.

While we mostly spoke about R and Python, Abdul’s most insightful comment, in my opinion, had to do with neither. While talking about online tutorials and training, he spoke about how most tutorials related to data science are aimed at the entry level, for people wanting to become data scientists, and that there was very little readymade material to help people become better data scientists.

And from my vantage point, as someone who has been heavily trying to recruit data scientists through the course of this year, this is spot on. A lot of profiles I get (most candidates who apply to my team get put through an open ended assignment) seem uncorrelated with the stated years of experience on their CVs. Essentially, a lot of them just appear “very junior”.

This “juniority”, in most cases, comes through in the way that people have done their assignments. A telltale sign, for example, is an excessive focus on necessary but nowhere sufficient things such as data cleaning, variable transformation, etc. Another telltale sign is the simple application of methods without bothering to explain why the method was chosen in the first place.

Apart from the lack of tutorials around, one reason why the quality of data science profiles continues to remain “junior” could be the organisation of teams themselves. To become better at your job, you need interact with people who are better than you at your job. Unfortunately, the rapid rise in demand for data scientists in the last decade has meant that this peer learning is not always there.

Yes – if you are a bunch of data scientists working together, you can pull each other up. However, if many of you have come in through the same process, it is that much more difficult – there is no benchmark for you.

The other thing is the structure of the teams (I’m saying this with very little data, so call me out if I’m bullshitting) – unlike software engineers, data scientists seldom work in large teams. Sometimes they are scattered across the organisation, largely working with tech or business teams. In any case, companies don’t need that many data scientists. So the number is low to start off with as well.

Another reason is the structure of the market – for the last decade the demand for data scientists has far exceeded the available supply. So that has meant that there is no real reason to upskill – you’ll get a job anyway.

Abdul’s solution, in the absence of tutorials, is for data scientists to look at other people’s code. The R community, for example, has a weekly Tidy Tuesday data challenge, and a lot of people who take that challenge put up their code online. I’m pretty certain similar resources exist for Python (on Kaggle, if not anywhere else).

So for someone who wants to see how other data scientists work and learn from them, there is plenty of resources around.

PS: I want to record a podcast episode on the “pile stirring” epidemic in machine learning (where people simply throw methods at a dataset without really understanding why that should work, or understanding the basic math of different methods). So far I’ve been unable to find a suitable guest. Recommendations welcome.