A banker’s apology

Whenever there is a massive stock market crash, like the one in 1987, or the crisis in 2008, it is common for investment banking quants to talk about how it was a “1 in zillion years” event. This is on account of their models that typically assume that stock prices are lognormal, and that stock price movement is Markovian (today’s movement is uncorrelated with tomorrow’s).

In fact, a cursory look at recent data shows that what models show to be a one in zillion years event actually happens every few years, or decades. In other words, while quant models do pretty well in the average case, they have thin “tails” – they underestimate the likelihood of extreme events, leading to building up risk in the situation.

When I decided to end my (brief) career as an investment banking quant in 2011, I wanted to take the methods that I’d learnt into other industries. While “data science” might have become a thing in the intervening years, there is still a lot for conventional industry to learn from banking in terms of using maths for management decision-making. And this makes me believe I’m still in business.

And like my former colleagues in investment banking quant, I’m not immune to the fat tail problem as well – replicating solutions from one domain into another can replicate the problems as well.

For a while now I’ve been building what I think is a fairly innovative way to represent a cricket match. Basically you look at how the balance of play shifts as the game goes along. So the representation is a line graph that shows where the balance of play was at different points of time in the game.

This way, you have a visualisation that at one shot tells you how the game “flowed”. Consider, for example, last night’s game between Mumbai Indians and Chennai Super Kings. This is what the game looks like in my representation.

What this shows is that Mumbai Indians got a small advantage midway through the innings (after a short blast by Ishan Kishan), which they held through their innings. The game was steady for about 5 overs of the CSK chase, when some tight overs created pressure that resulted in Suresh Raina getting out.

Soon, Ambati Rayudu and MS Dhoni followed him to the pavilion, and MI were in control, with CSK losing 6 wickets in the course of 10 overs. When they lost Mark Wood in the 17th Over, Mumbai Indians were almost surely winners – my system reckoning that 48 to win in 21 balls was near-impossible.

And then Bravo got into the act, putting on 39 in 10 balls with Imran Tahir watching at the other end (including taking 20 off a Mitchell McClenaghan over, and 20 again off a Jasprit Bumrah over at the end of which Bravo got out). And then a one-legged Jadhav came, hobbled for 3 balls and then finished off the game.

Now, while the shape of the curve in the above curve is representative of what happened in the game, I think it went too close to the axes. 48 off 21 with 2 wickets in hand is not easy, but it’s not a 1% probability event (as my graph depicts).

And looking into my model, I realise I’ve made the familiar banker’s mistake – of assuming independence and Markovian property. I calculate the probability of a team winning using a method called “backward induction” (that I’d learnt during my time as an investment banking quant). It’s the same system that the WASP system to evaluate odds (invented by a few Kiwi scientists) uses, and as I’d pointed out in the past, WASP has the thin tails problem as well.

As Seamus Hogan, one of the inventors of WASP, had pointed out in a comment on that post, one way of solving this thin tails issue is to control for the pitch or  regime, and I’ve incorporated that as well (using a Bayesian system to “learn” the nature of the pitch as the game goes on). Yet, I see I struggle with fat tails.

I seriously need to find a way to take into account serial correlation into my models!

That said, I must say I’m fairly kicked about the system I’ve built. Do let me know what you think of this!

PM’s Eleven

The first time I ever heard of Davos was in 1997, when then Indian Prime Minister HD Deve Gowda attended the conference in the ski resort and gave a speech. He was heavily pilloried by the Kannada media, and given the moniker “Davos Gowda”.

Maybe because of all the attention Deve Gowda received for the trip, and not in a good way, no Indian Prime Minister ventured to go there for another twenty years. Until, of course, Narendra Modi went there earlier this week and gave a speech that apparently got widely appreciated in China.

There is another thing that connects Modi and Deve Gowda as Prime Ministers (leaving aside trivialties such as them being chief ministers of their respective states before becoming Prime Ministers).

Back in 1996 when Deve Gowda was Prime Minister, Rahul Dravid,  Venkatesh Prasad and Sunil Joshi made their Test debuts (on the tour of England). Anil Kumble and Javagal Srinath had long been fixtures in the Indian cricket team. Later that year, Sujith Somasunder played a couple of one dayers. David Johnson played two Tests. And in early 1997, Doddanarasaiah Ganesh played a few Test matches.

In case you haven’t yet figured out, all these cricketers came from Karnataka, the same state as the Prime Minister. During that season, it was normal for at least five players in the Indian Eleven to be from Karnataka. Since Deve Gowda had become Prime Minister around the same time, there was no surprise that the Indian cricket team was called “PM’s Eleven”. Coincidentally, the chairman of selectors at that point in time was Gundappa Vishwanath, who is also from Karnataka.

The Indian team playing in the current Test match in Johannesburg has four players from Gujarat. Now, this is not as noticeable as five players from Karnataka because Gujarat is home to three Ranji Trophy teams. Cheteshwar Pujara plays for Saurashtra, Parthiv Patel and Jasprit Bumrah play for Gujarat, and Hardik Pandya plays for Baroda. And Saurashtra’s Ravindra Jadeja is also part of the squad.

It had been a long time since once state had thus dominated the Indian cricket team. Perhaps we hadn’t seen this kind of domination since Karnataka had dominated in the late 1990s. And it so happens that once again the state dominating the Indian cricket team happens to be the Prime Minister’s home state.

So after a gap of twenty one years, we had an Indian Prime Minister addressing Davos. And after a gap of twenty one years, we have an Indian cricket team that can be called “PM’s Eleven”!

As Baada put it the other day, “Modi is the new Deve Gowda. Just without family and sleep”.

Update: I realised after posting that I have another post called “PM’s Eleven” on this blog. It was written in the UPA years.

Duckworth Lewis Book

Yesterday at the local council library, I came across this book called “Duckworth Lewis” written by Frank Duckworth and Tony Lewis (who “invented” the eponymous rain rule). While I’d never heard about the book, given my general interest in sports analytics I picked it up, and duly finished reading it by this morning.

The good thing about the book is that though it’s in some way a collective autobiography of Duckworth and Lewis, they restrict their usual life details to a minimum, and mostly focus on what they are famous for. There are occasions when they go into too much detail describing a trip to either Australia or the West Indies, but it’s easy to filter out such stuff and read the book for the rain rule.

Then again, it isn’t a great book. If you’re not interested in cricket analytics there isn’t that much for you to know from the book. But given that it’s a quick read, it doesn’t hurt so much! Anyway, here are some pertinent observations:

  1. Duckworth and Lewis didn’t get paid much for their method. They managed to get the ICC to accept their method sometime in the mid 90s, but it wasn’t until the early 2000s, by when Lewis had become a business school professor, that they managed to strike a financial deal with ICC. Even when they did, they make it sound like they didn’t make much money off it.
  2. The method came about when Duckworth quickly put together something for a statistics conference he was organising, where another speaker who was supposed to speak about cricket pulled out at the last minute. Lewis later came across the paper, and then got one of his undergrad students to do a project about it. The two men subsequently collaborated
  3. It’s amazing (not in a positive way) the kind of data that went into the method. Until the early 2000s, the only dataset that was used to calibrate the method was what was put together by Lewis’s undergrad. And this was mostly English County games, played over 40, 55 and 60 overs. Even after that, the frequency of updation with new data (which reflects new playing styles and strategies) is rather low.
  4. The system doesn’t seem to have been particularly well software engineered – it was initially simply coded up by Duckworth, and until as late as 2007 it ran on the DOS operating system. It was only in 2008 or so, when Steven Stern joined the team (now the method is called DLS to include his name), that a windows version was introduced.
  5. There is very little discussion of alternate methods, and though there is a chapter about it, Duckworth and Lewis are rather dismissive about them. For example, another popular method is by this guy called V Jayadevan from Thrissur. Here is some excellent analysis by Srinivas Bhogle where he compares the two methods. Duckworth and Lewis spend a couple of pages listing a couple of scenarios where Jayadevan’s method doesn’t work, and then spends a paragraph disparaging Bhogle for his support of the VJD method.
  6. This was the biggest takeaway from the book for me – the Duckworth Lewis method doesn’t equalise probabilities of victory of the two teams before and after the rain interruption. Instead, the method equalises the margin of victory between the teams before and after the break. So let’s say a team was 10 runs behind the DL “par score” when it rains. When the game restarts, the target is set such that the team is still 10 runs behind the par score! They make an attempt to explain why this is superior to equalising probabilities of winning  but don’t go too far with it.
  7. The adoption of Duckworth Lewis seems like a fairly random event. Following the World Cup 1992 debacle (when South Africa’s target went from 22 off 13 to 22 off 1 ball after a rain break), there was a demand for new rain rules. Duckworth and Lewis somehow managed to explain their method to the ECB secretary. And since it was superior to everything that was there then, it simply got adopted. And then it became incumbent, and became hard to dislodge!
  8. There is no mention in the book about the inherent unfairness of the DL method (in that it can be unfair to some playing styles).

Ok this is already turning out to be a long post, but one final takeaway is that there’s a fair amount of randomness in sports analytics, and you shouldn’t get into it if your only potential customer is a national sporting body. In that sense, developments such as the IPL are good for sports analytics!

Mike Hesson and cricket statistics

While a lot is made of the use of statistics in cricket, my broad view based on presentation of statistics in the media and the odd player/coach interview is that cricket hasn’t really learnt how to use statistics as it should. A lot of so-called insights are based on small samples, and coaches such as Peter Moores have been pilloried for their excess focus on data.

In this context, I found this interview with New Zealand coach Mike Hesson in ESPNCricinfo rather interesting. From my reading of the interview, he seems to “get” data and how to use it, and helps explain the general over-performance to expectations of the New Zealand cricket team in the last few years.

Some snippets:

You’re trying to look at trends rather than chuck a whole heap of numbers at players.

For example, if you look at someone like Shikhar Dhawan, against offspin, he’s struggled. But you’ve only really got a nine or ten-ball sample – so you’ve got to make a decision on whether it’s too small to be a pattern

Also, players take a little while to develop. You’re trying to select the player for what they are now, rather than what their stats suggest over a two or three-year period.

And there are times when you have to revise your score downwards. In our first World T20 match, in Nagpur, we knew it would slow up,


Go ahead and read the whole thing.

On cricket writing

This piece where Suveen Sinha of the Hindustan Times calls out Dhoni’s “joke” with respect to retirement has an interesting tailpiece:

When Dhoni was bantering with the Australian, the other journalists in the hall were laughing. They would, no sports journalist would want to be anything but nice to the formidable Indian captain. That’s why this piece had to be written by someone whose day job is to write on business and economy.

Looking at the reports of the incidents from both Sinha and EspnCricinfo’s standpoints, it is clear to me that Sinha’s view is more logical. That Dhoni’s calling of the journalist to the press conference table and cross-questioning him was unprofessional on the one hand and showed his lack of defences on the other.

Yet, the ending to Sinha’s piece also explains why other sports journalists have taken to lauding Dhoni’s view rather than critisicing him – for them, access to the Indian limited overs captain is important, and they wouldn’t like to damage that by taking an Australian colleague’s side.

The problem with a lot of sports journalism in general, and Indian cricket journalism in particular, is that jingoism and support for one’s team trumps objective reporting and analysis. One example of this was coverage from Indian and Australian newspapers of the Monkeygate scandal in 2007-08 (when Harbhajan Singh called Andrew Symonds a monkey).

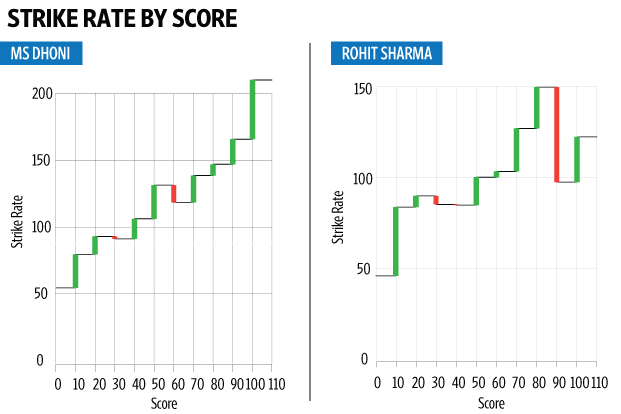
More recently, there was the controversy about India losing games because of the tendency of Rohit Sharma (and Indian batsmen in general) to slow down in their 90s. Again, commentary about that took jingoistic tones, with the Indian sports media coming out strongly in favour of Sharma. There were reports defending his “commitment” and “grit” and all such flowery language sports journalists love, and that Glenn Maxwell’s comment was entirely unwarranted. Maxwell even backed down on his comments.

Data, however, showed that Maxwell need not have backed down on his comments. Some analysis based on ball-by-ball data that I published in Mint showed clearly that Indian batsmen do slow down in their 90s, and of all recent players, Sharma was the biggest culprit.

Indian batsmen slowing down in their 90s. My analysis for Mint
Rohit Sharma is among the biggest culprits in terms of slowing down in the 90s

The piece was a hit and was widely shared on social media. What was more interesting, however, was the patterns in which it was shared. For one, the editors at Mint loved it and shared it widely. It was also shared widely by mango people and people with a general interest in cricket.

The class of people which was conspicuous by its absence of commentary on my piece was sports journalists. While it could be reasoned that they didn’t see the piece (appearing as it did in a business publication, though I did send emails to some of them), my reasoning is that this piece didn’t gain much traction among them because it didn’t fit their priors, and didn’t fit the jingoistic narrative they had been building.

It is not necessary, though, that someone only shares pieces that they completely agree with – it is a fairly common practice to share (and abuse) pieces which you vehemently disagree with. The commentary I found about this piece was broadly positive – few people who had shared the piece disagreed with it.

My (untested) hypothesis on this is that this analysis flew in the face of all that mainstream sports journalists had been defending over the previous few days – that Maxwell’s comments were simply not true, or that Sharma was a committed cricketer, and all such hyperbole. With data being harder to refute (only option being to poke holes in the analysis, but this analysis was rather straightforward), they chose to not give it further publicity.

Of course, I might be taking too much credit here, but that doesn’t take away from the fact that there is a problem with sports (and more specifically, cricket) writing. Oh, and as for the ultra-flowery language, I’ll save my comments for another day and another post.


Super-specialisation in cricket

Cricket has always been a reasonably specialised sport. You are either a batsman or a bowler or a wicketkeeper or an all-rounder. If you’re a bowler, you’re classified based on your bowling arm and the speed at which you bowl and the spin you impart the ball (last two are not independent). If you’re a batsman you’re classified based on your batting stance and whether you’re an opener or a middle-order batsman.

In Test cricket, there’s further specialisation if you’re a middle-order batsman. You have specialist Number Threes, like Rahul Dravid or Ricky Ponting. You have specialist Number Fours, like Sachin Tendulkar or Younis Khan. Five and six are fungible, but a required ability for both these positions is the ability to bat with the tail.

In One Day cricket, too, there’s some degree of specialisation within the middle order but it’s not to the same extent as in Test Cricket. In One Day cricket, batting orders are more flexible and situation-based. You do have specialist threes (Dravid and Ponting again come to mind) and sixes (usually hitters) but the super-specialisation is not as much as in Test Cricket.

A logical extension of this would be that in T20 cricket, which is played over an even shorter duration and where batting orders are even more flexible, you don’t need even as much of specialisation as in ODIs. However, Siddharth Monga argues in this piece that this lack of specialisation is why India isn’t doing as well as it could in T20s (having just lost the home series to South Africa).

In other words, what Monga is arguing is that Kohli, Raina and Sharma are all similar batsmen and effectively Number Threes for their IPL franchises, and when they are arranged 2-4 or 3-5 in the Indian national team, two of them are effectively batting out of position.

It would be interesting if Monga is indeed right and that T20s require a higher degree of specialisation than ODIs. It is also interesting that India’s number 6, MS Dhoni, bats like a typical number 5 in T20s, accumulating for a while before going bonkers. Maybe T20 will end up as a much more specialised sport than Tests? That would be interesting to watch.

Reminded of the Tied Test in Chennai

I started watching the ongoing Test match just after tea, with the score at 210/2 or something. And the resemblances with *that* Test match in Chennai in 1986 were striking.

https://www.youtube.com/watch?v=Hjyaz-vCAb8

1. Australia declared twice in both games. In both games they declared after losing 7 wickets in the first innings and 5 wickets in the second.

2. Overnight declaration on day 4, leaving India to score at approximately 4 an over on the last day

3. Good finger spinners – Lyon here, Bright and Matthews there.

4. Three hundreds for Australia in the first innings – Boon, Border and Jones there; Clarke, Smith and Warner here

Ok there was no Virat Kohli like innings but it seems like he’s combining the roles of Sunil Gavaskar (who scored 90) and Ravi Shastri (who led the final charge with 48*) here. Let’s see how it goes.

Posted with India at 299/6

Moeen Ali and the counterfactual

There has been much furore in the cricketing world over the last couple of days after the ICC (International Cricket Council) appointed match referee for the ongoing England-India Test match censured England player Moeen Ali for wearing wrist bands in support of Gaza. One the second day of the Test match, when he batted, Ali wore wristbands that said “Free Palestine” and “Save Gaza”.

While the England and Wales Cricket Board (ECB) absolved him of any wrongdoing claiming it was his personal beliefs, the ICC has been less kind to him stating that this is in violation of the ICC code that prevents cricketers from making political or racial statements on the field. Ali has been asked to play the rest of the game without the wrist bands, and might face a fine for the violation of the Code of Conduct.

Source: NDTV

What has complicated matters, however, is that during the third day of the Test match, the English players (including Ali) all wore a “Help for Heroes” message on their shirt collars. Help for heroes is a UK military charity and the symbol on the shirts was meant to commemorate a century of the start of the Great War. As expected this supposed “double standards” by the ICC (allowing the England team to wear a message in support of a charity but not allowing Ali to wear a message in support of Palestine) has drawn attention from commentators about double standards by the ICC.

While it is true that the ongoing undeclared war between Israel and Hamas has been largely one-sided in terms of casualties, and that a large number of Palestinian civilians have been collateral damage in the conflict, we should look at Ali’s wristbands as some kind of a positioning with respect to an (undeclared) ongoing war. And in order to determine whether his message was appropriate, we should use the “flip test”.

What if instead of supporting Gaza, a player in the ongoing Test (Virat Kohli, say, without loss of generality) wore wrist bands supporting Israel? What if Kohli wore bands that said “Save Israel” or “Free Israel”? Would the ICC have reacted similarly? And if the ICC had reacted similarly would commentators have reacted the same way as they have now, censuring the ICC for its stance?

I’m not trying to take sides here, and whether Ali’s wristbands were to be banned is a complex issue beyond the scope of this blog. All I’m trying to say here, however, is that a decision on a case like this should be agnostic of the side that the possibly offensive player is taking. A political statement is a political statement, and whether it falls within the limits of the code of conduct has to be determined irrespective of the side that it is taking. That is the only way regulation can be impartial.

Classifying cricket grounds

For some work I’m trying to classify cricket grounds. The question is if we can classify cricket grounds based on what kind of cricket they support. Some pitches are slow and low – it is hard to score runs, but also hard to get the batsman out. Some others are fast and bouncy – easy to score and easy to get out. Then you have the “batting pitches” – easy to score and hard to get out and “bowling pitches” – hard to score but easy to take wickets.

Essentially I’m trying to see if I can classify a ground into one of the above four regimes (or a superposition of them) at different stages in a game – this will help estimate how the rest of the game is going to play out.

For this, I was looking at the runs per ball and balls per wicket statistic for a number of grounds based on T20 matches. All grounds which hosted over 10 T20 matches (international or IPL) before the 10th of April have been considered for this analysis. It is interesting, to say the least.

Here is the scatter plot – bottom right (only the Oval) is easy to score, easy to get out. Top right are the batting pitches, bottom left the bowling pitches and top left the slow-and-low! It is interesting that the “most bowling pitch” of the lot is Chittagong! The only Indian ground that can be classified thus is DY Patil Sports Academy in Navi Mumbai!

t20grounds

Wasps have thin tails, or why cricket prediction algorithms fail..

A couple of months back, i was watching a One Day International match between New Zealand and India. it was during this series that the WASP algorithm for predicting score at the end of the innings (for the team batting first) and chances of victory (for the team batting second) first came in to public prominence. During the games, the scorecard would include the above data, which was derived from the WASP algorithm.

This one game that I was watching (I think it was the fourth match of the series), New Zealand was chasing. They were fifty odd without loss, and WASP showed their chances of winning as somewhere around 60%. Then Jesse Ryder got out. Suddenly, the chances of winning, as shown on screen dropped to the forties! How can the fall of one wicket, and at an early stage in the game, influence a game so much? The problem is with the algorithm.

Last year, during the IPL, i tried running this graphic that I called the “Tug-of-War”, that was to depict how the game swung between the two teams. Taking the analogy forward, if you were to imagine the game of cricket as a game of Tug-of-War, the graph plotted the position of the middle of the rope as a function of time. Here is a sample graphic from last year:

baseplot


This shows how the game between the Pune Warriors and Sun Risers “moved”. The upper end of the graph represents the Sun Risers’ “line” and the lower end the line of the Pune Warriors. So we can see from this graph that for the first half of the Sun Risers innings (they batted first), the Sun Risers were marginally ahead. Then Pune pulled it back in the second half, and then somewhere midway through the Pune Innings, the SunRisers pulled it back again, and eventually won the game.

At least that’s the intention with which I started putting out this graphic. In practice, you can see that there is a problem. Check out the graph somewhere around the 8th over of the Pune innings. This was when Marlon Samuels got out. How can one event change the course of the game so dramatically? It was similar to the movement in the WASP when Ryder got out in the recent NZ-India match.

So what is the problem here? Based on the WASP algorithm that the designers have kindly published, and the algorithm I used for last year’s IPL (which was Monte Carlo-based), the one thing common is that both algorithms are Markovian (I know mine is, and from what WASP has put out, I’m guessing theirs is, too). To explain in English, what our algorithms assume is that what happens in the next ball doesn’t depend on what has happened so far. The odds of different events on the next ball (dot, six, single, out, etc.) are independent of how the previous balls have shaped up – this is the assumption that our algorithms use. And since that doesn’t accurately represent what happens in a cricket match, we end up with “thin tails”.

Recently, to evaluate IPL matches, with a view of evaluating players ahead of the auction, I reverse engineered the WASP algorithm, and decided to see what it says about the score at the end of an ODI innings. Note that my version is team agnostic, and assumes that every ball is bowled by “the average bowler” to “the average batsman”. The distribution of team score at the end of the first innings, as calculated by my algorithm, can be seen in the blue line in the graph below. The red line shows the actual distribution of score at the end of an ODI innings in the last 5 years (same data that’s been used to construct the model).

wasptails

Note how the blue curve has a much higher peak, and tails off very quickly on either side. In other words, a lot of “mass” is situated within a small range of scores, and this leads to the bizarre situations as you can see in the first graph, and what I saw in the New Zealand India game.

The problem with a dynamic programming based approach, such as WASP, is that you need to make a Markovian assumption, and that assumption results in thin tails. And when you are trying to predict the probability of victory, and are using a curve such as the blue one above as your expected distribution of score at the end of the innings, events such as a six or a wicket can drastically alter your calculated odds.

To improve the cricket prediction system, what we need is an algorithm that can replicate the “fat tails” that the actual distribution of cricket scores shows. My current Monte Carlo based algorithm doesn’t cut it. Neither does the WASP.