Simpson’s Paradox for Levitt’s Measure

Some of you might know that I do this daily covid-19 update on twitter (not linking since I delete each day’s posts the next morning). A couple of weeks back I revamped it, in advance of which I asked what people wanted to see.

A lot of people suggested I use “Levitt’s metric”. I ignored it. Then, after I had revamped the output last week, two people I know very well got in touch asking me to report that metric every morning in my update. This time I decided to do it, and added it to my update on Monday.

My daily update has the smoothed line using a loess smoothing, but I also wanted to see if I can “predict” when the pandemic might end in different places. And so I did a linear fit as well (using 1 month of data – the slope of the line is highly sensitive to how far back you go), and posted it on Twitter.

I’ve extended the X axis of the graph until the end of the year. The idea is that when the blue line (the regression line based on the last 30 data points) hits the red line, the pandemic in that place is “effectively over”. So we can predict when the pandemic might end in different places.

Now, if you slightly contort your neck and try and extend the “india” graph here rightwards, you might see that the pandemic might end (for all practical purposes) around February. The funny thing is that while on average the pandemic might end in India in February, we see that for specific regions the slope is actually increasing (which suggests the pandemic might never end).

And this creates confusion. When you have a bunch of regions with upward slopes, and then suddenly for the aggregate (India) it is a downward slope, it doesn’t make intuitive sense. It is similar to Simpson’s paradox, where a trend disappears when you aggregate data. This graph possibly represents the most famous example of Simpson’s paradox.

Back to the Levitt’s metric, my only explanation is that the curve can’t be infinitely upward sloping – the number of people in any place is finite and so the disease is bound to die out some time or the other. The upward sloping lines are only a figment of the arbitrary linear extrapolation, and are likely to turn down sooner rather than later.

3 x 4 = 6 x 2

I’ll get to the “weird” title of this post soon.

Over at The Paper, which Suprio Guha Thakurta and I have been writing for two months now, one of our ongoing themes (in the context of the pandemic) is that “people will continue to do the same things, but do them in a different way”. We have corollaries to this and all that.

Here is one corollary that is suited more for this blog than it is to The Paper. Basically, when people do things in a different way, they do more of and less of certain smaller things, and this more and less balance out (that explains the title). OK I don’t think you would have understood any of that so let me clarify with some examples.

People are going to commute less (more working from home, less going out and all that), but when they commute, they are far more likely to use cars than using public transport. So the amount of traffic on the road remains a constant.

There will be far fewer “casual restaurant visits”, so when people want to go out to eat, they want to make sure it counts. So they go to really nice places. The “mass luxury” mid-tier places might lose out.

There will be fewer guests at weddings, since in some places the law mandates that now, and people won’t want to go to very crowded events. However, since the number of guests is going to be smaller, people can afford more lavish weddings “per guest”. So they’ll book fancier (if smaller) halls than they would earlier. Fancier (if fewer) meals. Put up guests in hotels rather than in crowded choultries.

In all this there will be winners and losers. The wedding caterer who charges per guest is a loser. The guy supplying the more fancy stuff (or the hotel guy) might be the winner. The large wedding hall guy is a loser. The fancy small hall guy is a winner.

And so on and so forth.

So this post was triggered by two things I saw during a walk yesterday. I first passed by a small-ish (but nice) hall that used to be used for small functions back in the day. It was hosting a wedding yesterday, and the few people who were there seemed rather well dressed up. Far better dressed than people dress for weddings in Bangalore.

Two minutes later, I paused while crossing the road to make way for a bus, and started thinking about when the next time would be when I would take public transport. And then decided to write this.


Gym pricing

In a weird sort of way, this is a blog-length expansion of a flippant thought I put out as a tweet.

Back to topic – gym memberships are a bundle. They bundle together the ability to use the gym over a long contiguous block of time. It doesn’t matter whether you want to go once a week or every day, in most gyms you have no choice but to buy the full bundle.

In some gyms (such as the one I was a member of before the lockdown started), there was more than the opportunity to use the equipment that was thrown into the bundle – the gym conducted lots of group classes every day. The option to join one of these classes (or maybe more – I never tried) was also bundled into the membership. Similarly, in an earlier gym I was a member of, the membership came bundled with the option to use squash courts, and use the gym bar.

The bundling made sense – cognitively it was easy on the members. The advantage of bundling is that marginal costs are kept at zero, which means mental accounting becomes far easier. Should I go to the gym today? I only need to think about whether I have the time and want the exercise. The decision is not complicated by money that I might have to spend. Similarly, should I join the class or just lift weights? Again depends upon mood and not on whether I need to pay anything for anything.

In any case, the pandemic and lockdown completely ruined the bundle. A lot of the options that were part of the bundle were forced to expire un-exercised since the gym was mandated to be closed (it’s unclear if they’re giving us any extensions of memberships once they restart this week).

Moreover, once the gyms restart (while they have been allowed to start on Wednesday, so far there’s been no communication from my gym on when they’re actually starting), they are likely to want to ensure some sort of social distancing. This means that the sort of bundles that they would sell earlier will be very hard to sustain.

Earlier, the bundle had both the option to attend the rather crowded 6:30 am class or the rather empty 9:30 am class. There was no differential pricing, and for good reason – mental costs were kept low. Now, in case the gym decides that the number of people per class needs to be capped (mgiht have to do that to ensure social distancing), the bundle will become unworkable.

It will be as if the members who can only attend the rather crowded 6:30 am class and no other class are part of the same chit fund, betting against each other so that they can attend their favourite class. From the gym’s point of view, this is not workable.

While gyms worldwide have for long benefited from extreme bundling (with massive discounts for long-term contracts), with the understanding that people won’t utilise a large portion of that bundle, the post-pandemic era that restricts the number of people who can attend the gym at the same time might cause this model to unravel.

It will be interesting to see how the gym pricing models evolve. I liked this model that a gym my wife briefly attended follows – which was like the mobile phone plans of olden days. For a fixed sum, you would be entitled to a certain number of classes that had to be utilised in a certain number of days (eg. 6 classes in a month). And then you would have to book online to book a class and exercise each of these options.

Then again, a lot of gyms belong to what I call the “passion economy” – people who are in business because they are passionate about something rather than because they are good at business. So I don’t know how rational they will be with their pricing.

Leaks and deluges

What connects South Korea, Vietnam, Singapore, Kerala, Karnataka and Andhra Pradesh? All these regions were, at some point of time or the other, hailed for their deft handling of the covid-19 crisis.

Some of them, such as Vietnam and Singapore have continued to do well. New Zealand has also done rather well, and it continues to keep its border closed. However, shit has hit the fan in Karnataka and Andhra Pradesh in terms of number of cases. All the diligence in containment earlier seems to be of no use now, only delaying the inevitable.

So what happened?

Essentially the way you deal with a leak and the way you do with a deluge are vastly different.

When you have a leak, you know that there is a good chance that you can try to stem it. You first put in some temporary measure to slow it down so that the hole doesn’t become bigger, and then you find something – a rubber patch, or some M-seal, or a piece of string, or some plaster (or a combination of these) to plug the leak.

Once the leak has been plugged you are safe. There are no more leaks in the foreseeable future. The damage is likely to have been limited.

When the flow of water from the damaged source is too heavy, though, stemming leaks just doesn’t work. You can try to stem it, but the pressure is so intense that the water finds its way around it. And the more the effort you put in stemming, the more the likelihood that when the water breaks through it is going to damage you.

When you are dealing with a deluge, the optimal strategy is to not try and stop the deluge. That is usually futile. The focus needs to be on mitigation and management – take the deluge as a given, and that some damage is guaranteed, and try to figure out how best you are going to limit the damage to the extent possible.

Some states in India, such as Karnataka or Kerala or Andhra Pradesh, had been blessed with “thin inlet pipes” in terms of the covid-19 virus. The initial case loads in these states was low, so a strategy of a lockdown (which was national anyways) combined with strong contact tracing and testing kept the disease under wraps. The “models” of these states were lauded at one time or another.

And then inter-state borders opened up. As people streamed in from neighbouring states that had not been blessed by thin inlet pipes, the pipes into these hitherto thick states became thick. Not realising this happened, these states continued with their old “trace and test” strategy. It doesn’t seem to be helping.

Cases are exploding in these states. And the same old strategy is being persisted with. Bangalore even did a week-long lockdown that ended on Tuesday, putting many livelihoods at risk.

I have come to firmly believe that there are no “good strategies” in terms of combating the disease unless strict border controls can be maintained. Anything any government does in terms of tracing and testing and locking down will only slow the inevitable – it doesn’t make the place safe from the disease itself.

The only purpose of containment measures, I have come to believe, is to spread out the severe cases over time, so that hospitals are not overwhelmed, and those who can be helped by medical care can get that help.

In fact, if you remember, this was the original meaning of “flattening the curve”. Over time, people have come up with their own definitions of the phrase, looking at the number of new cases, number of cases, number of deaths and what not.

The original purpose of lockdown was to let the infection spread in a controlled manner, not to prevent the spread of the disease altogether (which is near-impossible). We would do well to remember that.

Omnichannel retail

About 10 days back I decided that the number of covid-19 positive cases in Bangalore was high enough to recalibrate my risk levels. So I decided I’m not going to go to “indoor shops” (where you have to step inside the shop) any more.

Instead, as much as possible I would buy from “over the counter” shops (where you don’t have to step inside). This way, I would avoid being indoors, and as long as I’m outdoors (and wearing a mask) when I’m out of homeI should be reasonably safe.

However, over the years we have come to need a lot of things that at least in an Indian context can be classified as “long tail”. Over the last three months I’ve been buying them from the large format Namdhari store close to home. Now, that’s a large airconditioned shop which my new risk levels don’t allow me to go to. So I decided to order from their website.

Now, Namdhari is a classic “omnichannel retail” (the phrase was told to me by one of the guys who helped set it up). There is no warehouse – all customer orders are fulfilled from stores. You could think of it like calling your local shop and asking for delivery.

As you can imagine, this can lead to insane inventory issues, especially for a shop like Namdhari’s that specialises in long tail stuff. It is pretty impossible for a store to reconcile how much stock is there in the store with the website (even with perfect technology, you’ll miss out on what is there in people’s (physical) charts).

There is also the issue of prioritisation of customers that they are kept in the dark about. If the shop has a limited inventory of any item (and with long tail stuff, even a small spike in demand can make inventory very limited), how does it allocate it between people who have trudged all the way to the store and those who have prepaid for it on the website?

I wasn’t that surprised, I guess, when half the items that I had ordered failed to arrive. The delivery guy told me that the rest of my money would get refunded.

I wondered why they wouldn’t try to fulfil my order the next day instead. This brings me to my next grouse – there is no real reasons sometimes to provide same day delivery. If you offer next day delivery then you know tomorrow delivery volumes beforehand, and it will be easy for you to stock up. These guys had this process, it seems, where you have to order for the same day and if the thing runs out you don’t get it at all.

In any case, three days after my half-fulfilled order had been delivered I got a mail that refund had been initiated for the items I had ordered but hadn’t arrived.

It was like writing a cheque. Cheques are inefficient because between the time it is written and encashed, neither the giver nor the receiver has access to the funds (online transfer such as IMPS, on the other hand, ensures that the money is in either the giver or receiver’s account at all points in time).

So my order which had been partially fulfilled was in a similar trishanku state – I didn’t know if it would arrive or if I should order the same items from elsewhere. In case I waited I would have the risk of getting the stuff even later (since I’d delay order from elsewhere).

It was only after it failed to arrive on Wednesday (and I got the mail) that I was able to place an order from elsewhere. Hopefully this one won’t get into trishanku state as well.

What is the Case Fatality Rate of Covid-19 in India?

The economist in me will give a very simple answer to that question – it depends. It depends on how long you think people will take from onset of the disease to die.

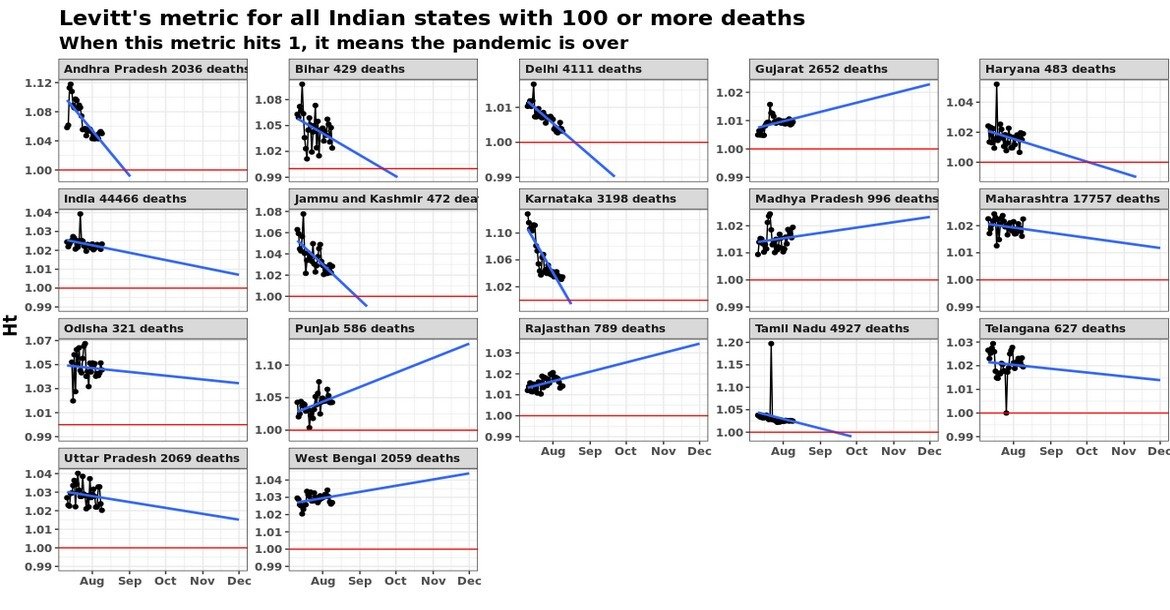
The modeller in me extended the argument that the economist in me made, and built a rather complicated model. This involved smoothing, assumptions on probability distributions, long mathematical derivations and (for good measure) regressions.. And out of all that came this graph, with the assumption that the average person who dies of covid-19 dies 20 days after the thing is detected.


Yes, there is a wide variation across the country. Given that the disease is the same and the treatment for most people diseased is pretty much the same (lots of rest, lots of water, etc), it is weird that the case fatality rate varies by so much across Indian states. There is only one explanation – assuming that deaths can’t be faked or miscounted (covid deaths attributed to other reasons or vice versa), the problem is in the “denominator” – the number of confirmed cases.

What the variation here tells us is that in states towards the top of this graph, we are likely not detecting most of the positive cases (serious cases will get themselves tested anyway, and get hospitalised, and perhaps die. It’s the less serious cases that can “slip”). Taking a state low down below in this graph as a “good tester” (say Andhra Pradesh), we can try and estimate what the extent of under-detection of cases in each state is.

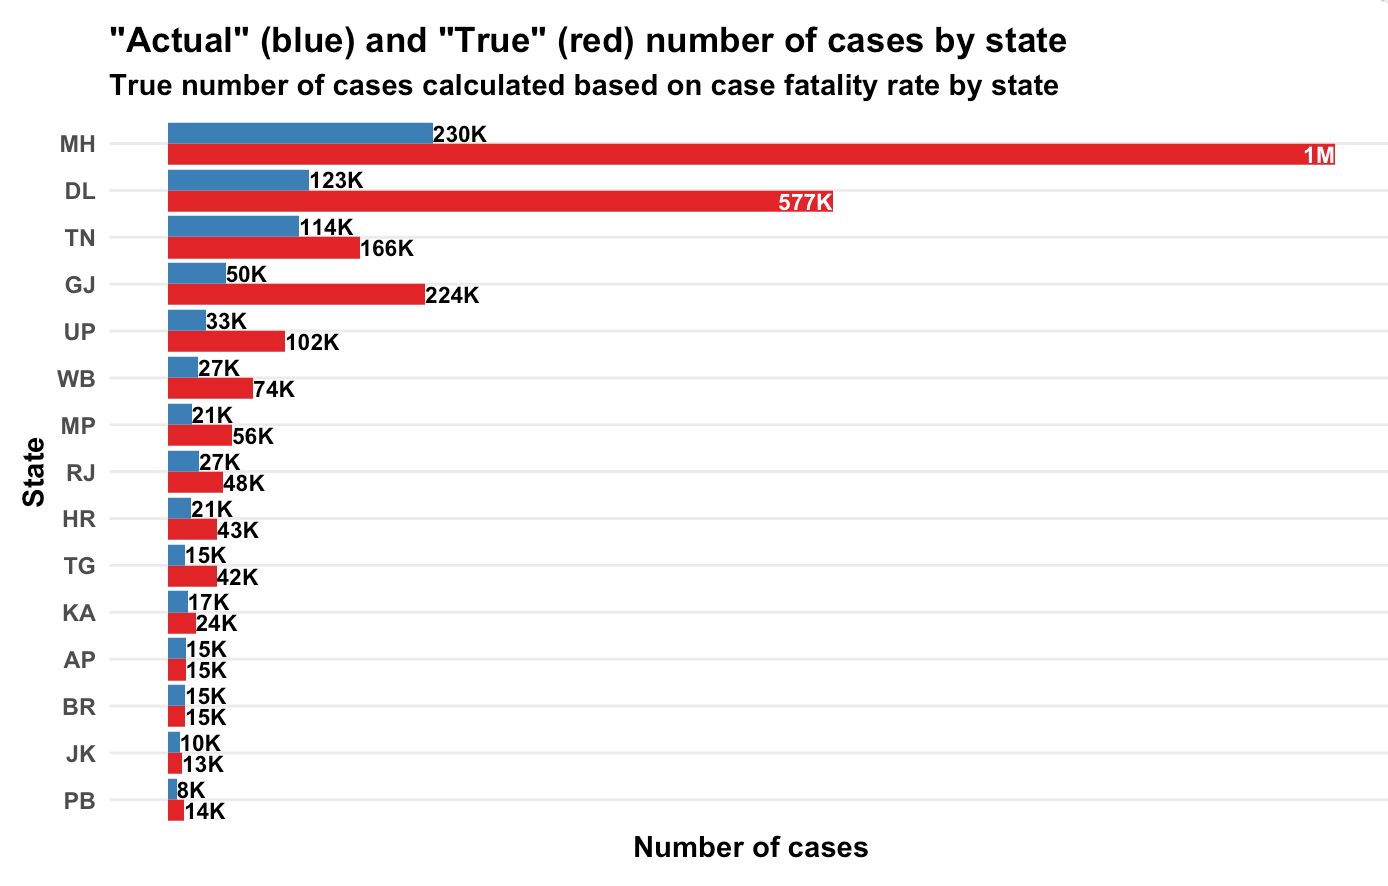
Based on state-wise case tallies as of now (might be some error since some states might have reported today’s number and some mgiht not have), here are my predictions on how many actual number of confirmed cases there are per state, based on our calculations of case fatality rate.

Yeah, Maharashtra alone should have crossed a million caess based on the number of people who have died there!

Now let’s get to the maths. It’s messy. First we look at the number of confirmed cases per day and number of deaths per day per state (data from here). Then we smooth the data and take 7-day trailing moving averages. This is to get rid of any reporting pile-ups.

Now comes the probability assumption – we assume that a proportion p of all the confirmed cases will die. We assume an average number of days (N) to death for people who are supposed to die (let’s call them Romeos?). They all won’t pop off exactly N days after we detect their infection. Let’s say a proportion \lambda dies each day. Of everyone who is infected, supposed to die and not yet dead, a proportion \lambda will die each day.

My maths has become rather rusty over the years but a derivation I made shows that \lambda = \frac{1}{N}. So if people are supposed to die in an average of 20 days, \frac{1}{20} will die today, \frac{19}{20}\frac{1}{20} will die tomorrow. And so on.

So people who die today could be people who were detected with the infection yesterday, or the day before, or the day before day before (isn’t it weird that English doesn’t a word for this?) or … Now, based on how many cases were detected on each day, and our assumption of p (let’s assume a value first. We can derive it back later), we can know how many people who were found sick k days back are going to die today. Do this for all k, and you can model how many people will die today.

The equation will look something like this. Assume d_t is the number of people who die on day t and n_t is the number of cases confirmed on day t. We get

d_t = p  (\lambda n_{t-1} + (1-\lambda) \lambda n_{t-2} + (1-\lambda)^2 \lambda n_{t-3} + ... )

Now, all these ns are known. d_t is known. \lambda comes from our assumption of how long people will, on average, take to die once their infection has been detected. So in the above equation, everything except p is known.

And we have this data for multiple days. We know the left hand side. We know the value in brackets on the right hand side. All we need to do is to find p, which I did using a simple regression.

And I did this for each state – take the number of confirmed cases on each day, the number of deaths on each day and your assumption on average number of days after detection that a person dies. And you can calculate p, which is the case fatality rate. The true proportion of cases that are resulting in deaths.

This produced the first graph that I’ve presented above, for the assumption that a person, should he die, dies on an average 20 days after the infection is detected.

So what is India’s case fatality rate? While the first graph says it’s 5.8%, the variations by state suggest that it’s a mild case detection issue, so the true case fatality rate is likely far lower. From doing my daily updates on Twitter, I’ve come to trust Andhra Pradesh as a state that is testing well, so if we assume they’ve found all their active cases, we use that as a base and arrive at the second graph in terms of the true number of cases in each state.

PS: It’s common to just divide the number of deaths so far by number of cases so far, but that is an inaccurate measure, since it doesn’t take into account the vintage of cases. Dividing deaths by number of cases as of a fixed point of time in the past is also inaccurate since it doesn’t take into account randomness (on when a Romeo might die).

Anyway, here is my code, for what it’s worth.

deathRate <- function(covid, avgDays) {
covid %>%
mutate(Date=as.Date(Date, '%d-%b-%y')) %>%
gather(State, Number, -Date, -Status) %>%
spread(Status, Number) %>%
arrange(State, Date) -> 
cov1

# Need to smooth everything by 7 days 
cov1 %>%
arrange(State, Date) %>%
group_by(State) %>%
mutate(
TotalConfirmed=cumsum(Confirmed),
TotalDeceased=cumsum(Deceased),
ConfirmedMA=(TotalConfirmed-lag(TotalConfirmed, 7))/7,
DeceasedMA=(TotalDeceased-lag(TotalDeceased, 7))/ 7
) %>%
ungroup() %>%
filter(!is.na(ConfirmedMA)) %>%
select(State, Date, Deceased=DeceasedMA, Confirmed=ConfirmedMA) ->
cov2

cov2 %>%
select(DeathDate=Date, State, Deceased) %>%
inner_join(
cov2 %>%
select(ConfirmDate=Date, State, Confirmed) %>%
crossing(Delay=1:100) %>%
mutate(DeathDate=ConfirmDate+Delay), 
by = c("DeathDate", "State")
) %>%
filter(DeathDate > ConfirmDate) %>%
arrange(State, desc(DeathDate), desc(ConfirmDate)) %>%
mutate(
Lambda=1/avgDays,
Adjusted=Confirmed * Lambda * (1-Lambda)^(Delay-1)
) %>%
filter(Deceased > 0) %>%
group_by(State, DeathDate, Deceased) %>%
summarise(Adjusted=sum(Adjusted)) %>%
ungroup() %>%
lm(Deceased~Adjusted-1, data=.) %>%
summary() %>%
broom::tidy() %>%
select(estimate) %>%
first() %>%
return()
}

Coming back to life

On Sunday, I met a friend for coffee. In normal times that would be nothing extraordinary. What made this extraordinary was that this was the first time since the lockdown started that I was actually meeting a non-family member casually, for a long in-person conversation.

I’m so tired of the three pairs of shorts and five T-shirts that I’ve been wearing every day since the lockdown started that I actually decided to dress up that day. And bothered to take a photo at a signal on the way to meeting him.

We met at a coffee shop in Koramangala, from where we took away coffees and walked around the area for nearly an hour, talking. No handshakes. No other touches. Masks on for most of the time. And outdoors (I’m glad I live in Bangalore whose weather allows you to be outdoors most of the year). Only issue was that wearing a mask and walking and talking for an hour can tire you out a bit.

The next bit of resurrection happened yesterday when I had an in-person business meeting for the first time in three months. Parking the car near these people’s office was easier than usual (less business activity I guess?), though later I found that my windshield was full of bird shit (I had parked under a tree).

For the first time ever while going into this office, I got accosted by a security guard at the entrance, asking where I was headed, taking my temperature and offering me hand sanitiser. Being a first time, I was paranoid enough to use the umbrella I was carrying to operate the lift buttons, and my mask was always on.

There were no handshakes. The room was a bit stuffy and I wasn’t sure if they were using the AC, so I asked for the windows to be opened (later they turned on the AC saying it’s standard practice there nowadays). Again, no handshakes or anything. We kept our masks on for a long time. They offered water in a bottle which I didn’t touch for a long time.

Until one of them suggested we could order in dosas from a rather famous restaurant close to their office (and one that I absolutely love). The dosas presently arrived, and then all masks were off. For the next half hour as the dosas went down it was like we were back in “normal times” again, eating together and talking loudly without masks. I must say I missed it.

I took the stairs down to avoid touching the lift. Walked back to the car (and birdshit-laden windshield) and quickly used hand sanitiser. I hadn’t carried my laptop or notebook for the meeting, and I quickly made notes using the voice notes app of my phone.

Yes, in normal times, a lot of this might appear mundane. But given that we’re now sort of “coming back to life” after a long and brutal lockdown, a lot of this deserves documentation.

Oh, and I’m super happy to meet people now. Given a choice, I prefer outdoors. Write in if you want to meet me.

covid-19 and mental health

I don’t know about you but the covid-19 pandemic and the associated lockdown have had a massive (negative) impact on my mental health. And from the small number of people I’ve spoken to about this, I don’t think I’m alone in this.

Before I continue I must mention that in the past I’ve been diagnosed with ADHD, anxiety and depression, though I haven’t been under medication for any of them for a long time now.

For starters, there’s the anxiety related to the disease itself. Every three or four days I suffer from what I’ve now come to dub “psychological corona”. Most of the times this is triggered by an allergy I get (I’m allergic to pollen from the tree in front of my house, a fact I conveniently forgot until I had bought this house). I start sneezing and coughing, and start imagining the worst.

One time, though, this “psychological corona” was legit thanks to my own stupidity. I had accepted a sample that a nearby baker had offered me, taking off my mask to eat it, and then remembered that he had been coughing before I entered the shop. And then panicked. I had thought later that I should write a blogpost on “the importance of keeping a consistent risk level” but then forgot.

The next level of anxiety is work-related. I’m lucky enough that I had a medium-term ongoing project at the time the lockdown started. This anxiety is regarding whether these clients will continue to pay, and if so, for how long. I don’t think I want to comment much on this issue (beyond bringing this up).

What I have mentioned so far is possibly what everyone has been going through. And then there is the “next layer”.

I have a 3 3/4 year old at home, and her school has been shut for over three months now. We don’t employ any help to take care of her (in other words, we use her school as our “child care”), and in normal times, we had worked out a method where we could get work done while still hanging out with her adequately.

Now, with the lockdown, this is doubly hard. We have settled on a method where the wife and I work in alternating 90 minute bands, with the person who “isn’t working” in that time band hanging out outside the study with the child. One of the responsibilities of the “person outside” is to ensure that the child doesn’t knock on the door.

This worked fine for me as long as I mostly had “fighter work” to do, as I could switch on and off at will as I entered and exited the room (though sometimes I found it harder to switch off when exiting). For the last month or so, my work has been more stud than fighter, and this band-based system has been a disaster. Most times, by the time I get into the zone, my slot is over.

And not getting work done in my slot is the least of my problems. The thing is that I’m “always working”, either trying to work on my work, or parenting (school meant that the total hours of work were far fewer). And it can be tiring. And from the point of view of my ADHD (I can easily get distracted and lose my train of thought), getting constant outside stimulus (even if it’s from close family) can be extremely draining.

What makes the problem really bad is that most outlets that help me normally deal with life are now absent. All sport has been shut, though nowadays football has been trickling back to life (yes, next Sunday I’m staying up late to watch Everton-Liverpool).

Getting regular exercise has been a part of my usual protocol of managing my mental health and it doesn’t help that gyms are closed (my gym wants to open, the state government wnats to open gyms, but the union government isn’t giving permission).

Children under 10 aren’t allowed to go out here “except for essential purposes” (I don’t understand the reason behind this, since the pandemic hasn’t really been affecting children). This means we can’t go out as a family. My wife and I can’t go to a shop together. I can’t take my daughter to a park (which is a big way in which I’ve bonded with her over the years).

The list is not complete but I’ll stop here since this is turning into a long rant. I’m pretty sure you have your own list of how the pandemic has hurt your mental health. And the lockdown isn’t helping one big on this.

Oh, and if there are therapists you recommend, please recommend.

Mata Amrita Goes To New York Times

Remember that I had written recently that the pandemic is likely to change the practice of hugging, and the Mata Amrita Index? Now the New York Times has also covered it (possibly paywalled). It includes helpful graphics on “how to hug and how not to hug”.

It is an interesting article, quoting an expert on aerosols about what is the best way to hug. From what I gather, the key is to keep your faces turned away from each other. As long as you maintain this, hugging should still be fine.

[…] the safest thing is to avoid hugs. But if you need a hug, take precautions. Wear a mask. Hug outdoors. Try to avoid touching the other person’s body or clothes with your face and your mask. Don’t hug someone who is coughing or has other symptoms.

And remember that some hugs are riskier than others. Point your faces in opposite directions — the position of your face matters most. Don’t talk or cough while you’re hugging. And do it quickly. Approach each other and briefly embrace. When you are done, don’t linger. Back away quickly so you don’t breathe into each other’s faces. Wash your hands afterward.

Most of this seems fine. Only the last bit seems a bit difficult to implement – how do you wash your hands soon after hugging someone without offending them? I mean – I face this problem already. There are many people I come across whose hands I shake (this is all pre-pandemic) which leave me queasy and at unease until I have washed my hands. The challenge in this situation is how to efficiently wash your hands without making it explicit that the handshake wasn’t a pleasant one.

My favourite bit in the article, however, is the last one. It pertains to the “quality of hugs” that I’ve been talking about for a while now, and also happens to bring in Marie Kondo into the picture.

Dr. Marr noted that because the risk of a quick hug with precautions is very low but not zero, people should choose their hugs wisely.

“I would hug close friends, but I would skip more casual hugs,” Dr. Marr said. “I would take the Marie Kondo approach — the hug has to spark joy.”

Covid-19 superspreaders in Karnataka

Through a combination of luck and competence, my home state of Karnataka has handled the Covid-19 crisis rather well. While the total number of cases detected in the state edged past 2000 recently, the number of locally transmitted cases detected each day has hovered in the 20-25 range.

Perhaps the low case volume means that Karnataka is able to give out data at a level that few others states in India are providing. For each case, the rationale behind why the patient was tested (which is usually the source where they caught the disease) is given. This data comes out in two daily updates through the @dhfwka twitter handle.

There was this research that came out recently that showed that the spread of covid-19 follows a classic power law, with a low value of “alpha”. Basically, most infected people don’t infect anyone else. But there are a handful of infected people who infect lots of others.

The Karnataka data, put out by @dhfwka  and meticulously collected and organised by the folks at covid19india.org (they frequently drive me mad by suddenly changing the API or moving data into a new file, but overall they’ve been doing stellar work), has sufficient information to see if this sort of power law holds.

For every patient who was tested thanks to being a contact of an already infected patient, the “notes” field of the data contains the latter patient’s ID. This way, we are able to build a sort of graph on who got the disease from whom (some people got the disease “from a containment zone”, or out of state, and they are all ignored in this analysis).

From this graph, we can approximate how many people each infected person transmitted the infection to. Here are the “top” people in Karnataka who transmitted the disease to most people.

Patient 653, a 34 year-old male from Karnataka, who got infected from patient 420, passed on the disease to 45 others. Patient 419 passed it on to 34 others. And so on.

Overall in Karnataka, based on the data from covid19india.org as of tonight, there have been 732 cases where a the source (person) of infection has been clearly identified. These 732 cases have been transmitted by 205 people. Just two of the 205 (less than 1%) are responsible for 79 people (11% of all cases where transmitter has been identified) getting infected.

The top 10 “spreaders” in Karnataka are responsible for infecting 260 people, or 36% of all cases where transmission is known. The top 20 spreaders in the state (10% of all spreaders) are responsible for 48% of all cases. The top 41 spreaders (20% of all spreaders) are responsible for 61% of all transmitted cases.

Now you might think this is not as steep as the “well-known” Pareto distribution (80-20 distribution), except that here we are only considering 20% of all “spreaders”. Our analysis ignores the 1000 odd people who were found to have the disease at least one week ago, and none of whose contacts have been found to have the disease.

I admit this graph is a little difficult to understand, but basically I’ve ordered people found for covid-19 in Karnataka by number of people they’ve passed on the infection to, and graphed how many people cumulatively they’ve infected. It is a very clear pareto curve.

The exact exponent of the power law depends on what you take as the denominator (number of people who could have infected others, having themselves been infected), but the shape of the curve is not in question.

Essentially the Karnataka validates some research that’s recently come out – most of the disease spread stems from a handful of super spreaders. A very large proportion of people who are infected don’t pass it on to any of their contacts.