Expertise

During the 2008 financial crisis, it was fairly common to blame experts. It was widely acknowledged that it was the “expertise” of economists, financial markets people and regulators that had gotten us into the crisis in the first place. So criticising and mocking them were part of normal discourse.

For example, most of my learning about the 2008 financial crisis came from following blogs written by journalists, such as Felix Salmon, and generalist academics such as Tyler Cowen or Alex Tabarrok or Arnold Kling, rather than blogs written by financial markets experts or practitioners. I don’t think it was very different for too many people.

Cut to 2020 and the covid-19 crisis, and the situation is very different. You have a bunch of people mocking experts (epidemiologists, primarily), but this is in the minority. The generic Twitter discourse seems to be “listen to the experts”.

For example, there was this guy called Tomas Pueyo who wrote a bunch of really nice blog posts (on Medium) about the possible growth of the disease. He got heavily attacked by people in the epidemiology and medicine professions, and (surprisingly to me)  the general twitter discourse backed this up. “We don’t need a silicon valley guy telling us epidemiology”, went the discourse. “Listen to the experts”.

That was perhaps the beginning of the “I’m not an epidemiologist but” meme (not a particularly “fit” meme in terms of propagation, but one that continues to endure). For example, when I wrote my now famous tweetstorm about Bayes’s theorem and random testing 2-3 weeks back, a friend I was discussing with it advised me to “get the thing checked with epidemiologists before publishing”.

This came a bit too late after I’d constructed the tweetstorm, and I didn’t want to abandon it, and so I told him, “but then I’m an expert on Probability and Bayes’s Theorem, and so qualified to put this” and went ahead.

In any case, I have one theory as to why “listen to the expert” has become the dominant discourse in this crisis. It has everything to do with politics.

Two events took place in 2016 that the “twitter establishment” (the average twitter user, weighted by number of followers and frequency of tweeting, if I can say) did not like – the passing of the Brexit referendum and the election of President Trump.

While these two surprising events took place either side of the Atlantic, they were both seen as populist movements that were aimed at the existing establishment. Some commentators saw them as a backlash “against the experts”. The rise of Trump and Brexit (and Boris Johnson) were seen as part of this backlash against expertise.

And the “twitter establishment” (the average twitter user, weighted by number of followers and frequency of tweeting, if I can say) doesn’t seem to like either of these two gentlemen (Trump and Johnson), and they are supposed to be in power because of a backlash against experts. Closer home, in India, the Modi government allegedly doesn’t trust experts, which critics blame for ham-handed decisions like Demonetisation and pushing through of the Citizenship Amendment Act in the face of massive protests (the twitter establishment doesn’t like Modi either).

Essentially we have a bunch of political leaders who are unpopular with the twitter establishment, and who are in place because of their mistrust of expertise, and multiplying negative with negative, you get the strange situation where the twitter establishment is in love with experts now.

And so when mathematicians or computer scientists or economists (or other “Beckerians“) opine on covid-19, they are dismissed as being “not expert enough”. Because any criticism of expertise of any kind is seen as endorsement of the kind of politics that got Trump, Johnson or Modi into power. And the twitter establishment (the average twitter user, weighted by number of followers and frequency of tweeting, if I can say) doesn’t like that.
When a two-by-two ruins a scatterplot

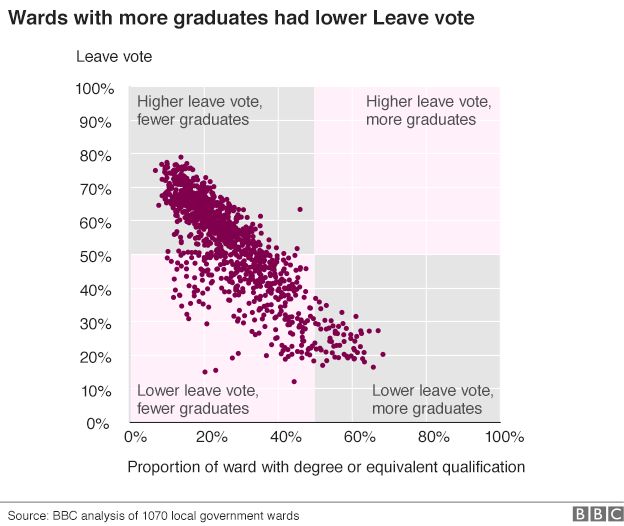
The BBC has some very good analysis of the Brexit vote (how long back was that?), using voting data at the local authority level, and correlating it with factors such as ethnicity and educational attainment.

In terms of educational attainment, there is a really nice chart, that shows the proportion of voters who voted to leave against the proportion of population in the ward with at least a bachelor’s degree. One look at the graph tells you that the correlation is rather strong:

‘Source: http://www.bbc.com/news/uk-politics-38762034And then there is the two-by-two that is superimposed on this – with regions being marked off in pink and grey. The idea of the two-by-two must have been to illustrate the correlation – to show that education is negatively correlated with the “leave” vote.

But what do we see here? A majority of the points lie in the bottom left pink region, suggesting that wards with lower proportion of graduates were less likely to leave. And this is entirely the wrong message for the graph to send.

The two-by-two would have been useful had the points in the graph been neatly divided into clusters that could be arranged in a grid. Here, though, what the scatter plot shows is a nice negatively correlated linear relationship. And by putting those pink and grey boxes, the illustration is taking attention away from that relationship.

Instead, I’d simply put the scatter plot as it is, and maybe add the line of best fit, to emphasise the negative correlation. If I want to be extra geeky, I might also write down the R^2 next to the line, to show the extent of correlation!


Brexit

My facebook feed nowadays is so full of Brexit that I’m tempted to add my own commentary to it. The way I look at it is in terms of option valuation.

While the UK economy hasn’t been doing badly over the last five years (steady strictly positive growth), this growth hasn’t been uniform and a significant proportion of the population has felt left out.

Now, Brexit can have a negative impact on two counts – first, it can have a direct adverse impact on the UK’s GDP (and also Europe’s GDP). Secondly, it can have an adverse impact by increasing uncertainty.

Uncertainty is in general bad for business, and for the economy as a whole. It implies that people can plan less, which they compensate for by means of building in more slacks and buffers. And these slacks and buffers  will take away resources that could’ve been otherwise used for growth, thus affecting growth more adversely.

While the expected value from volatility is likely to be negative, what volatility does is to shake things up. For someone who is currently “out of the money” (doing badly as things stand), though, volatility gives a chance to get “in the money”. There is an equal chance of going deeper out of the money, of course, but the small chance that volatility can bring them out of water (apologies for mixing metaphors) can make volatility appealing.

So the thing with the UK is that a large section of the population has considered itself to be “out of the money” in the last few years, and sees no respite from the existing slow and steady growth. From this background, volatility is a good thing, and anything that can shake things up deserves its chance!

And hence Brexit. It might lower overall GDP, and bring in volatility, but people hope that the mix of fortunes that stem from this volatility will affect them positively (and the negative effects go to someone else). From this perspective, the vote for Brexit is a vote of optimism, with voters in favour of Leave voting for the best possible outcome for themselves from the resulting mess.

In other words, each voter in the UK seems to have optimised for private best case, and hence voted for Brexit. Collectively, it might seem to be an irrational decision, but once you break it down it’s as rational as it gets!