Scott Adams, careers and correlation

I’ve written here earlier about how much I’ve been influenced by Scott Adams’s career advice about “being in top quartile of two or more things“.  To recap, this is what Adams wrote nearly ten years back:

If you want an average successful life, it doesn’t take much planning. Just stay out of trouble, go to school, and apply for jobs you might like. But if you want something extraordinary, you have two paths:

1. Become the best at one specific thing.
2. Become very good (top 25%) at two or more things.

The first strategy is difficult to the point of near impossibility. Few people will ever play in the NBA or make a platinum album. I don’t recommend anyone even try.

Having implemented this to various degrees of success over the last 5-6 years, I propose a small correction – basically to follow the second strategy that Adams has mentioned, you need to take correlation into account.

Basically there’s no joy in becoming very good (top 25%) at two or more correlated things. For example, if you think you’re in the top 25% in terms of “maths and physics” or “maths and computer science” there’s not so much joy because these are correlated skills. Lots of people who are very good at maths are also very good at physics or computer science. So there is nothing special in being very good at such a combination.

Why Adams succeeded was that he was very good at 2-3 things that are largely uncorrelated – drawing, telling jokes and understanding corporate politics are not very correlated to each other. So the combination of these three skills of his was rather unique to find, and their combination resulted in the wildly successful Dilbert.

So the key is this – in order to be wildly successful, you need to be very good (top 25%) at two or three things that are not positively correlated with each other (either orthogonal or negative correlation works). That ensures that if you can put them together, you can offer something that very few others can offer.

Then again, the problem there is that the market for this combination of skills will be highly illiquid – low supply means people who might demand such combinations would have adapted to make do with some easier to find substitute, so demand is lower, and so on. So in that sense, again, it’s a massive hit-or-miss!
When I missed my moment in the sun

Going through an old piece I’d written for Mint, while conducting research for something I’m planning to write, I realise that I’d come rather close to staking claim as a great election forecaster. As it happened, I just didn’t have the balls to stick my neck out (yes, mixed metaphors and all that) and so I missed the chance to be a hero.

I was writing a piece on election forecasting, and the art of converting vote shares into seat shares, which is tricky business in a first past the post system such as India. I was trying to explain how the number of “corners of contests” can have an impact on what seat share a particular vote share can translate to, and I wrote about Uttar Pradesh.

Quoting from my article:

An opinion poll conducted by CNN-IBN and CSDS whose results were published last week predicted that in Uttar Pradesh, the Bharatiya Janata Party is likely to get 38% of the vote. The survey reported that this will translate to about 41-49 seats for the BJP. What does our model above say?

If you look at the graph for the four-cornered contest closely (figure 4), you will notice that 38% vote share literally falls off the chart. Only once before has a party secured over 30% of the vote in a four-cornered contest (Congress in relatively tiny Haryana in 2004, with 42%) and on that occasion went on to get 90% of the seats (nine out of 10).

Given that this number (38%) falls outside the range we have noticed historically for a four-cornered contest, it makes it unpredictable. What we can say, however, is that if a party can manage to get 38% of the votes in a four-cornered state such as Uttar Pradesh, it will go on to win a lot of seats.

As it turned out, the BJP did win nearly 90% of all seats in the state (71 out of 80 to be precise), stumping most election forecasters. As you can see, I had it all right there, except that I didn’t put it in that many words – I chickened out by saying “a lot of seats”. And so I’m still known as “the guy who writes on election data for Mint” rather than “that great election forecaster”.

Then again, you don’t want to be too visible with the predictions you make, and India’s second largest business newspaper is definitely not an “obscure place”. As I’d written a long time back regarding financial forecasts,

…take your outrageous prediction and outrageous reasons and publish a paper. It should ideally be in a mid-table journal – the top journals will never accept anything this outrageous, and you won’t want too much footage for it also.

In all probability your prediction won’t come true. Remember – it was outrageous. No harm with that. Just burn that journal in your safe (I mean take it out of the safe before you burn it). There is a small chance of your prediction coming true. In all likelihood it wont, but just in case it does, pull that journal out of that safe and call in your journalist friends. You will be the toast of the international press.

So maybe choosing to not take the risk with my forecast was a rational decision after all. Just that it doesn’t appear so in hindsight.

Damming the Nile and diapers

One of the greatest engineering problems in the last century was to determine the patterns in the flow of the Nile. It had been clear for at least a couple of millennia that the flow of the river was not regular, and the annual flow did not follow something like a normal distribution.

The matter gained importance in the late 1800s when the British colonial government decided to dam the Nile. Understanding accurately the pattern of flows of the river was important to determine the capacity of the reservoir being built, so that both floods and droughts could be contained.

The problem was solved by Harold Edwin Hurst, a British hydrologist who was posted in Egypt for over 60 years in the 20th Century. Hurst defined his model as one of “long-range dependence”, and managed to accurately predict the variation in the flow of the river. In recognition of his services, Egyptians gave him the moniker “Abu Nil” (father of the Nile). Later on, Benoit Mandelbrot named a quantity that determines the long-range dependence of a time series after Hurst.

I’ve written about Hurst once before, in the context of financial markets, but I invoke him here with respect to a problem closer to me – the pattern of my daughter’s poop.

It is rather well known that poop, even among babies, is not a continuous process. If someone were to poop 100ml of poop a day (easier to use volume rather than weight in the context of babies), it doesn’t mean they poop 4ml every hour. Poop happens in discrete bursts, and the number of such bursts per day depends upon age, decreasing over time into adulthood.

One might think that a reasonable way to model poop is to assume that the amount of poop in each burst follows a normal distribution, and each burst is independent of the ones around it. However, based on a little over two months’ experience of changing my daughter’s diapers, I declare this kind of a model to be wholly inaccurate.

For, what I’ve determined is that far from being normal, pooping patterns follow long-range dependence. There are long time periods (spanning a few diaper changes) when there is no, or very little, poop. Then there are times when it flows at such a high rate that we need to change diapers at a far higher frequency than normal. And such periods are usually followed by other high-poop periods. And so on.

In other words, the amount of poop has positive serial correlation. And to use the index that Mandelbrot lovingly constructed and named in honour of Hurst, the Hurst exponent of my daughter’s (and other babies’) poop is much higher than 0.5.

This makes me wonder if diaper manufacturers have taken this long-range dependence into account while determining diaper capacity. Or I wonder if, instead, they simply assume that parents will take care of this by adjusting the inter-diaper-change time period.

As Mandelbrot describes towards the end of his excellent Misbehaviour of markets , you can  use so-called “multifractal models” which combine normal price increments with irregular time increments to get an accurate (fractal) representation of the movement of stock prices.

PS: Apologies to those who got disgusted by the post. Until a massive burst a few minutes ago I’d never imagined I’d be comparing the flows of poop and the Nile!

Pregnancy, childbirth, correlation, causation and small samples

When you’re pregnant, or just given birth, people think it’s pertinent to give you unsolicited advice. Most of this advice is couches in the garb ob “traditional wisdom” and as you might expect, the older the advisor the higher the likelihood of them proffering such advice. 

The interesting thing about this advice is the use of fear. “If you don’t do this you’ll forever remain fat”, some will say. Others will forbid you from eating some thing else because it can “chill the body”. 

If you politely listen to such advice the advice will stop. But if you make a counter argument, these “elders” (for the lack of a better word) make what I call the long-term argument. “Now you might think this might all be fine, but don’t tell me I didn’t advice you when you get osteoporosis at the age of 50”, they say. 

While most of this advice is well intentioned, the problem with most such advice is that it’s based on evidence from fairly small samples, and are prone to the error of mistaking correlation for causation. 

 While it is true that it was fairly common to have dozens of children even two generations ago in india, the problem is that most of the advisors would have seen only a small number of babies based on which they form their theories – even with a dozen it’s not large enough to confirm the theory to any decent level of statistical significance. 

The other problem is that we haven’t had the culture of scientific temperament and reasoning for long enough in india for people to trust scientific methods and results – people a generation or two older are highly likely to dismiss results that don’t confirm their priors. 

And add to this confirmation bias – where cases of people violating “traditional wisdom” and then having some kind of problem are more likely to be noticed rather than those that had issues despite following “traditional wisdom” and you can imagine the level of non-science that can creep into so-called conventional wisdom. 
We’re at a hospital that explicitly tries to reverse these pre existing biases (I’m told that at a lactation class yesterday they firmly reinforced why traditional ways of holding babies while breastfeeding are incorrect) and that, in the face of “elders”‘ advice, can lead to potential conflict. 

On the one hand we have scientific evidence given by people who you aren’t likely to encounter too many more times in life. On the other you have unscientific “traditional” wisdom that comes with all kinds of logical inconsistencies given by people you encounter on a daily basis. 

Given this (im)balance, is there a surprise at all that scientific evidence gets abandoned in favour of adoption and propagation of all the logical inconsistencies? 

PS: recently I was cleaning out some old shelves and found a copy of this book called “science, non science and the paranormal”. The book belonged to my father, and it makes me realise now that he was a so-called “rationalist”. 

At every opportunity he would encourage me to question things, and not take them at face value. And ever so often he’d say “you are a science student. So how can you accept this without questioning”. This would annoy some of my other relatives to no end (since they would end up having to answer lots of questions by me) but this might also explain why I’m less trusting of “traditional wisdom” than others of my generation. 

Half life of pain

Last evening, the obstetrician came over to check on the wife, following the afternoon’s Caesarean section operation. Upon being asked how she was, the wife replied that she’s feeling good, except that she was still in a lot of pain. “In how many days can I expect this pain to subside?”, she asked.

The doctor replied that it was a really hard question to answer, since there was no definite time frame. “All I can tell you is that the pain will go down gradually, so it’s hard to say whether it lasts 5 days or 10 days. Think of this – if you hurt your foot and there’s a blood clot, isn’t the recovery gradual? It’s the same in this case”.

While she was saying this, I was reminded of exponential decay, and started wondering whether post-operative pain (irrespective of the kind of surgery) follows exponential decay, decreasing by a certain percentage each day; and when someone says pain “disappears” after a certain number of days, it means that pain goes below a particular  threshold in that time period – and this particular threshold can vary from person to person.

So in that sense, rather than simply telling my wife that the pain will “decrease gradually”, the obstetrician could have been more helpful by saying “the pain will decrease gradually, and will reduce to half in about N days”, and then based on the value of N, my wife could determine, based on her threshold, when her pain would “go”.

Nevertheless, the doctor’s logic (that pain never “disappears discretely”) had me impressed, and I’ve mentioned before on this blog about how I get really impressed with doctors who are logically aware.

Oh, and I must mention that the same obstetrician who operated on my wife yesterday impressed me with her logical reasoning a week ago. My then unborn daughter wasn’t moving too well that day, because of which we were in hospital. My wife was given steroidal injections, and the baby started moving an hour later.

So when we mentioned to the obstetrician that “after you gave the steroids the baby started moving”, she curtly replied “the baby moving has nothing to do with the steroidal injections. The baby moves because the baby moves. It is just a coincidence that it happened after I gave the steroids”.

Randomising wear and tear of safety razor

A few months back, having mostly given up on my Gillette Mach 3, I decided to go all old school and get myself a safety razor. While I cut myself occasionally (one day I cut myself right on my Adam’s apple, giving me a minor scare that I’d slit my throat), I’m significantly happier with the results of this razor, compared to the Mach 3.

I find that I need to shave only a single time, compared to two rounds with the Mach3, and cleaning the razor in the middle of the shave is also far easier. And while it isn’t absolutely smooth, it leaves me mostly satisfied at the end of the shave. And I’m not even mentioning the cost saving here!

The only “problem” with using an old-school safety razor is that it takes in double-edged blades. Having used multi-blade cartridges all my shaving life thus far (my father had bought me a Sensor Excel when I was first ready to shave, which I later traded for a Mach3), I started using a single side of the blade to complete the entire shave.

In my experience, a decent blade should last about 6 shaves, as long as you use both edges of the blade equally. The challenge here was to know (visually) which side of the blade you had used, so that you could get the maximum out of the blade!

Initially I thought of using stickers or some such paraphernalia to indicate which side of the blade I’d used each time. After a little thought, however, I realised that if this was a common problem, the razor itself would’ve come with an asymmetrical head, so I could keep track. There should be a better way to keep track, I reasoned.

And so I decided that I would use each edge of the blade half-and-half in each shave. The first day, it worked. The second, I had finished shaving half my face, when I realised I’d suddenly forgotten which side I’d used. An improved method was required.

So the solution I’ve finally hit on is to randomise the edge of the blade I use each time I rinse my blade in the middle of the shave. So each time I rinse the blade, I give it a random twirl, and use whatever edge that twirl turns up for my next set of strokes. And so forth. This way, in terms of expected value, both edges of the blade are likely to wear by a similar amount by the end of each shave!

And so if I find one day that an edge is blunt, it is highly likely that the opposite edge is also as blunt, and it is a clear indication to put in a new blade!

It is remarkable how so often randomised algorithms can help you trivially solve problems that cannot easily be solved by deterministic methods!

Curation, editing and predictability

One of my favourite lunchtime hobbies over the last one year has been watching chess videos. My favourite publishers in this regard are GM Daniel King and Mato Jelic. King is a far superior analyst and goes into more depth while analysing games, though Jelic has a far larger repertoire (King usually only analyses games the day they were played).

In some ways I might be biased towards Jelic because his analysis and focus are largely in line with my strengths back during my days as a competitive chess player. Deep opening analysis, attacking games, the occasional tactical flourish and so on. He has a particular fondness for the games of Mikhail Tal, showering praises on his (Tal’s) sometimes erratic and seemingly purposeless sacrifices.

Once you watch a few videos of Jelic, though, you realise that there is a formula to his commentary. At some point in the game, he announces that the game is in a “critical position” and asks the viewer to pause the video and guess the next move. And a few seconds of pause later, he proceeds to show the move and move on with the game.

While this is an interesting exercise the first few times around, after a few times I started seeing a pattern – Jelic has a penchant for attacking positions, and the moves following his “critical positions” are more often than not sacrifices. And once I figured this bit out, I started explicitly looking for sacrifices or tactical combination every time he asked me to pause, and that has made the exercise a lot less fun.

I’d mentioned on this blog a few weeks back about my problem with watching movies – in that I’m constantly trying to second-guess the rest of the movie based on the information provided thus far. And when a movie gets too predictable, it tends to lose my attention. And thinking about it, I think sometimes it’s about curation or editing that makes things too predictable.

To take an example, my wife and I have been watching Masterchef Australia this year (no spoilers, please!), and I remarked to her the other day that episodes have been too predictable – at the end of every contest, it seems rather easy to predict who might win or go down, and so there has been little element of surprise in the show.

My wife remarked that this was not due to the nature of the competition itself (which she said is as good as earlier editions), but due to the poor editing of the show – during each competition, there is a disproportional amount of time dedicated to showing the spectacularly good and spectacularly bad performances.

Consequently, just this information – on who the show’s editors have chosen to focus on for the particular episode – conveys a sufficient amount of information on each person’s performance, without even seeing what they’ve made! A more equitable distribution of footage across competitors, on the other hand, would do a better job of keeping the viewers guessing!

It is similar in the case of Jelic’s videos. There is a pattern to the game situation where he pauses, which biases the viewer in terms of guessing what the next move will be. In order to make the experience superior for his viewers, Jelic should mix it up a bit, occasionally showing slow Carlsen-like positions, and stopping games at positional “critical positions”, for example. That can make the pauses more interesting, and improve viewer experience!

What are other situations where bad editing effectively gives away the plot, and diminishes the experience?

Brexit

My facebook feed nowadays is so full of Brexit that I’m tempted to add my own commentary to it. The way I look at it is in terms of option valuation.

While the UK economy hasn’t been doing badly over the last five years (steady strictly positive growth), this growth hasn’t been uniform and a significant proportion of the population has felt left out.

Now, Brexit can have a negative impact on two counts – first, it can have a direct adverse impact on the UK’s GDP (and also Europe’s GDP). Secondly, it can have an adverse impact by increasing uncertainty.

Uncertainty is in general bad for business, and for the economy as a whole. It implies that people can plan less, which they compensate for by means of building in more slacks and buffers. And these slacks and buffers  will take away resources that could’ve been otherwise used for growth, thus affecting growth more adversely.

While the expected value from volatility is likely to be negative, what volatility does is to shake things up. For someone who is currently “out of the money” (doing badly as things stand), though, volatility gives a chance to get “in the money”. There is an equal chance of going deeper out of the money, of course, but the small chance that volatility can bring them out of water (apologies for mixing metaphors) can make volatility appealing.

So the thing with the UK is that a large section of the population has considered itself to be “out of the money” in the last few years, and sees no respite from the existing slow and steady growth. From this background, volatility is a good thing, and anything that can shake things up deserves its chance!

And hence Brexit. It might lower overall GDP, and bring in volatility, but people hope that the mix of fortunes that stem from this volatility will affect them positively (and the negative effects go to someone else). From this perspective, the vote for Brexit is a vote of optimism, with voters in favour of Leave voting for the best possible outcome for themselves from the resulting mess.

In other words, each voter in the UK seems to have optimised for private best case, and hence voted for Brexit. Collectively, it might seem to be an irrational decision, but once you break it down it’s as rational as it gets!

Movie plots and low probability events

First of all I don’t watch too many movies. And nowadays, watching movies has become even harder as I try to double-guess the plot.

Fundamentally, commercial movies like to tell stories that are spectacular, which means they should consist of low-probability events. Think of defusing bombs when there is 1 second left on the timer, for example, or the heroine’s flight getting delayed just so that the hero can catch her at the airport.

Now, the entire plot of the movie cannot consist of such low-probability events, for that will make the movie extremely incredulous, and people won’t like it. Moreover, a few minutes into such a movie, the happenings won’t be low probability any more.

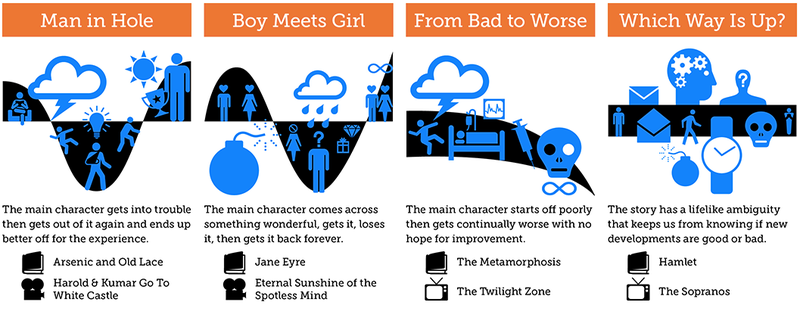
So the key is to intersperse high-probability events with low-probability events so that the viewer’s attention is maintained. There are many ways to do this, but as Kurt Vonnegut once wrote (in his masters thesis, no less), there are a few basic shapes that stories take. These shapes are popular methods in which high and low-probability events get interspersed so that the movie will be interesting.


Kurt Vonnegut’s Masters Thesis on the shapes of stories

So once you understand that there are certain “shapes” that stories take, you can try and guess how a movie’s plot will unfold. You make a mental note of the possible low-probability events that could happen, and with some practice, you will know how the movie will play out.

In an action movie, for example, there is a good chance that one (or more) of the “good guys” dies at the end. Usually (but not always), it is not the hero. Analysing the other characters in his entourage, it shouldn’t be normally hard to guess who will bite the dust. And when the event inevitably happens, it’s not surprising to you any more!

Similarly, in a romantic movie, unless you know that the movie belongs to a particular “type”, you know that the guy will get the girl at the end of the movie. And once you can guess that, it is not hard to guess what improbable events the movie will comprise of.

Finally, based on some of the action movies I’ve watched recently (not many, mind you, so there is a clear small samples bias here), most of their plots can be explained by one simple concept. Rather than spelling it in words, I’ll let you watch this scene from The Good, The Bad and The Ugly.

More optionality in startup valuations

Mint reports that Indian e-commerce biggies Flipkart and Snapdeal are finding it hard to raise more money at the valuations at which they raised their last funding rounds. One line from the report:

Despite Morgan Stanley’s markdown in February, Flipkart is still approaching investors asking for a valuation of $15 billion, but it hasn’t had any takers yet, the first two people cited above said.

The problem with the valuations is that it includes significant option value. It is common in startup funding to include implicit options in favour of the new round of investors to protect them from the downside of any future decrease in valuation.

Typically designed in the form of “ratchets”, when the firm raises a fresh round at a lower valuation, the investors in the previous round will get additional shares so that their overall share in the investment remains the same (won’t go into the exact mechanics here). This downside protection allows investors to be more aggressive on their valuations of the company, and the company is able to report higher headline numbers.

Ratchets have two problems, both of which are illustrated in the difficulty of Flipkart and Snapdeal in raising more funds. Firstly, optionality in funding means an automatic markdown of funds held by investors in progressively earlier rounds. This is not explicit, but a ratchet is basically existing investors writing an option in favour of the new investors. While the cost of this option is not explicit, it is the earlier investors who bear the cost.

So Series C (and earlier) investors bear the cost of the optionality given to Series D investors. Series B and earlier investors bear the cost of Series C’s optionality. And so on. Notice that this telescopes, so the founders (original owners of equity) have written options to everyone who has invested (of course they also benefit from the higher overall valuation).

Now, if a “down round” (funding round at lower overall valuation than previous round) happens, this optionality gets immediately gets “paid out”. So if the Series D valuation is lower than Series C valuation, Series B and earlier investors (and founders) immediately “pay” the difference to the Series C investors (these options are American, and usually without an expiry date). So Series B and earlier investors (and especially founders) will not like this round. And they will hunt around for offers that will ensure that they don’t have to pay out on the options they’ve written. I suspect this is what is happening at Flipkart and Snapdeal now.

The second problem with ratchets is that stated valuations are inflated. A common share in Flipkart (don’t think one exists. All investors in that firm are effectively either long or short an option in the same stock) is not valued at $15 billion, so that valuation is essentially a misnomer. When Morgan Stanley says on its books that Flipkart is actually worth $11 billion, it is possible that that is the “true value” of the stock, without accounting for the optionality that latest round of investors receive. In other words, the latest round of investors invested at a price, which if extended to all stock, would value the company at $15 billion. But the rest of the company’s stock is not the same as the stock these investors hold! 

The problem, though, is that the latest “headline valuation” (inclusive of optionality) is anchored in the minds of founders and other earlier investors, and they see any lower price as unacceptable. And so the logjam continues. It will be interesting to see how this plays out.

With IPO being way too far off an event for determining if a company has “arrived” I propose a new metric, with shorter horizon. A company can be declared as having arrived if it manages to raise a round of equity with no embedded options. Think about it!