This morning, I found this tweet by John Burn-Murdoch, a statistician at the Financial Times, about a graphic he had made for a Simon Kuper (of Soccernomics fame) piece on Jose Mourinho.
NEW: @KuperSimon digs into where it went wrong for Mourinho and Man United https://t.co/tpsHhY1PPK
Data from @clubelo show his infamous third season problem: José always reached his peak within his first two seasons at a club, and after that things went downhill rapidly pic.twitter.com/At1iswfX9j
— John Burn-Murdoch (@jburnmurdoch) December 18, 2018
Burn-Murdoch also helpfully shared the code he had written to produce this graphic, through which I discovered ClubElo, a website that produces chess-style Elo ratings for football clubs. They have a free and open API, through which Burn-Murdoch got the data for the above graphic, and which I used to download all-time Elo ratings for all clubs available (I can be greedy that way).
So the first order of business was to see how Liverpool’s rating has moved over time. The initial graph looked interesting, but not very interesting, so I decided to overlay it with periods of managerial regimes (the latter data I got through wikipedia). And this is what the all-time Elo rating of Liverpool looks like.
It is easy to see that the biggest improvement in the club’s performance came under the long reign of Bill Shankly (no surprises there), who took them from the Second Division to winning the old First Division. There was brief dip when Shankly retired and his assistant Bob Paisley took over (might this be the time when Paisley got intimidated by Shankly’s frequent visits to the club, and then asked him not to come any more?), but Paisley consolidated on Shankly’s improvement to lead the club to its first three European Cups.
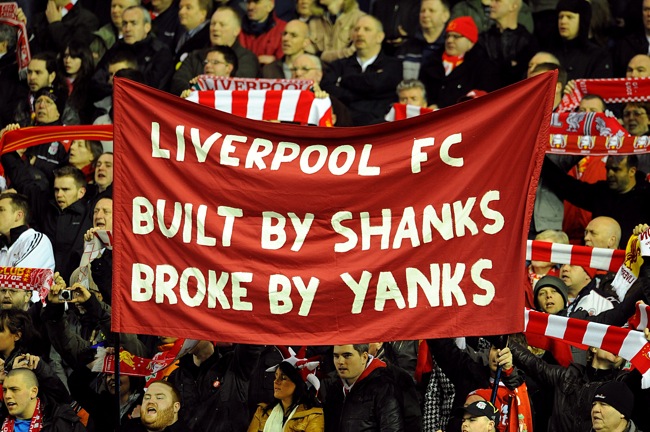
Around 2010, when the club was owned by Americans Tom Hicks and George Gillett and on a decline in terms of performance, this banner became popular at Anfield.

The Yanks were subsequently yanked following a protracted court battle, to be replaced by another Yank (John W Henry), under whose ownership the club has done much better. What is also interesting from the above graph is the managerial change decisions.
At the time, Kenny Dalglish’s sacking at the end of the 2011-12 season (which ended with Liverpool losing the FA Cup final to Chelsea) seemed unfair, but the Elo rating shows that the club’s rating had fallen below the level when Dalglish took over (initially as caretaker). Then there was a steep ascent under Brendan Rodgers (leading to second in 2013-14), when Suarez bit and got sold and the team went into deep decline.
Again, we can see that Rodgers got sacked when the team had reverted to the rating that he had started off with. That’s when Jurgen Klopp came in, and thankfully so far there has been a much longer period of ascendance (which will hopefully continue). It is interesting to see, though, that the club’s current rating is still nowhere near the peak reached under Rafa Benitez (in the 2008-9 title challenge).
Impressed by the story that Elo Ratings could tell, I got data on all Premier League managers, and decided to repeat the analysis for all clubs. Here is what the analysis for the so-called “top 6” clubs returns:
We see, for example, that Chelsea’s ascendancy started not with Mourinho’s first term as manager, but towards the end of Ranieri’s term – when Roman Abramovich had made his investment. We find that Jose Mourinho actually made up for the decline under David Moyes and Louis van Gaal, and then started losing it. In that sense, Manchester United have got their sacking timing right (though they were already in decline by the time they finished last season in second place).
Manchester City also seem to have done pretty well in terms of the timing of managerial changes. And Spurs’s belief in Mauricio Pochettino, who started off badly, seems to have paid off.
I wonder why Elo Ratings haven’t made more impact in sports other than chess!


One thought on “Built by Shanks”